The global leaderboard of wealth: $1.2 Quadrillion of Assets ranked by Market Cap
| ☆ | +/- | Asset Name | Type | Market Cap ($) | Price ($) | Market Cap 1Hr Δ ($) |
Market Cap 24Hr Δ ($) |
Market Cap 7d Δ ($) |
1Hr Change | 24Hr Change | 7d Change | Circ. Supply Max. Supply |
24Hr Volume | 24Hr Vol / Mkt Cap (%) |
Last 30 Days | Country | Sector | ||||
|---|---|---|---|---|---|---|---|---|---|---|---|---|---|---|---|---|---|---|---|---|---|
| ☆ | 1 | Real Estate REAL-ESTATE | Commodity | $447,614,667,068,012 | $213,164.11 | — | +$95,173,654,101 | — | — | +0.0% | — | 2,099,859,454 | $101,161 | 0.00% | Global | Commodities | |||||
| ☆ | 2 | Coal COAL | Commodity | $156,229,292,300,030 | $134.00 | — | -$62,516,723,609 | +$3,964,026,819,553 | — | -0.0% | +2.6% | 1,165,890,241,045 | $149,292 | 0.00% | Global | Commodities | |||||
| ☆ | 3 | Oil CL=F | Commodity | $155,515,200,000,000 | $86.88 | — | +$3,955,900,000,000 | -$6,461,900,000,000 | — | +2.6% | -4.0% | 1,790,000,000,000 | $20,447,034 | 0.00% | Global | Commodities | |||||
| ☆ | 4 | Government Bonds GOVT-BONDS | Bond | $117,628,200,191,000 | $99.16 | — | — | +$1,835,197,322,355 | — | — | +1.6% | 1,186,294,326,022 | — | — | Global | Bonds | |||||
| ☆ | 5 | Chinese Yuan CNYUSD=X | Currency | $51,260,131,507,200 | $0.15 | — | -$222,711,969,300 | +$129,088,713,900 | — | -0.4% | +0.3% | 347,190,000,000,000 | — | — | China | Forex | |||||
| ☆ | 6 | Gold GC=F | Commodity | $27,523,292,477,342 | $4,098.50 | — | -$57,081,367,832 | +$207,507,560,705 | — | -0.2% | +0.8% | 6,715,455,039 | $435,305,784 | 0.00% | Global | Commodities | |||||
| ☆ | 7 | United States dollar USDUSD=X | Currency | $22,442,100,000,000 | $1.00 | — | — | — | — | — | — | 22,442,100,000,000 | — | — | United States | Forex | |||||
| ☆ | 8 | Iron Ore IRON-ORE | Commodity | $19,600,000,000,000 | $98.00 | — | -$49,122,807,018 | -$84,000,000,000 | — | -0.2% | -0.4% | 200,000,000,000 | — | — | Global | Commodities | |||||
| ☆ | 9 | Copper HG=F | Commodity | $18,727,280,000,000 | $6.55 | — | +$235,950,000,000 | +$551,980,000,000 | — | +1.3% | +3.0% | 2,860,000,000,000 | $252,674 | 0.00% | Global | Commodities | |||||
| ☆ | 10 | Euro EURUSD=X | Currency | $18,669,020,207,127 | $1.15 | — | -$12,915,153,870 | +$246,203,020,443 | — | -0.1% | +1.3% | 16,204,710,000,000 | — | — | Europe | Forex | |||||
| ☆ | 11 | Aluminium ALUMINIUM | Commodity | $18,528,970,000,000 | $3,194.65 | — | +$3,705,052,989 | +$171,680,000,000 | — | +0.0% | +0.9% | 5,800,000,000 | — | — | Global | Commodities | |||||
| ☆ | 12 | Natural Gas NG=F | Commodity | $9,128,000,000,000 | $2.80 | — | +$136,920,000,000 | -$228,200,000,000 | — | +1.5% | -2.4% | 3,260,000,000,000 | $309,042 | 0.00% | Global | Commodities | |||||
| ☆ | 13 | Japanese yen JPYUSD=X | Currency | $8,122,633,024,904 | $0.01 | — | +$108,550,535,309 | +$318,126,591,795 | — | +1.4% | +4.1% | 1,279,111,700,000,000 | — | — | Japan | Forex | |||||
| ☆ | 14 | NVIDIA NVDA | Company | $4,862,365,925,376 | $196.87 | — | +$45,197,996,868 | -$235,128,377,150 | — | +0.9% | -4.6% | 24,221,000,000 | $27,554,151,994 | 0.57% | United States | Technology | |||||
| ☆ | 15 | Apple AAPL | Company | $4,537,070,911,488 | $310.96 | — | -$327,849,187,616 | -$350,464,507,634 | — | -6.7% | -7.2% | 14,687,356,000 | $41,198,822,042 | 0.91% | United States | Technology | |||||
| ☆ | 16 | Alphabet GOOG | Company | $4,361,806,151,680 | $338.05 | — | +$56,385,424,886 | — | — | +1.3% | — | 5,527,000,000 | $10,315,441,937 | 0.24% | United States | Communication Services | |||||
| ☆ | 17 | British Pound GBPUSD=X | Currency | $4,296,454,462,806 | $1.35 | — | +$5,553,070,618 | +$51,447,172,325 | — | +0.1% | +1.2% | 3,187,024,000,000 | — | — | United Kingdom | Forex | |||||
| ☆ | 18 | Microsoft MSFT | Company | $3,450,799,652,864 | $463.06 | — | +$89,127,896,705 | +$567,035,255,877 | — | +2.7% | +19.7% | 7,425,545,491 | $28,175,335,331 | 0.82% | United States | Technology | |||||
| ☆ | 19 | Silver SI=F | Commodity | $3,276,424,711,484 | $58.20 | — | +$23,306,526,298 | -$38,562,730,711 | — | +0.7% | -1.2% | 56,295,957,242 | $1,587,696 | 0.00% | Global | Commodities | |||||
| ☆ | 20 | South Korean won KRWUSD=X | Currency | $3,157,367,524,102 | $0.00 | — | -$35,231,552,278 | +$50,200,879,139 | — | -1.1% | +1.6% | 4,537,768,500,000,000 | — | — | Korea, South | Forex | |||||
| ☆ | 21 | Amazon AMZN | Company | $2,921,415,835,648 | $273.84 | — | +$409,024,034,352 | +$291,778,860,302 | — | +16.3% | +11.1% | 10,757,109,436 | $35,340,358,491 | 1.21% | United States | Consumer Cyclical | |||||
| ☆ | 22 | Hong Kong dollar HKDUSD=X | Currency | $2,627,021,965,078 | $0.13 | — | +$167,695,136 | +$100,740,690 | — | +0.0% | +0.0% | 20,601,368,000,000 | — | — | Hong Kong | Forex | |||||
| ☆ | 23 | Australian dollar AUDUSD=X | Currency | $2,363,289,853,500 | $0.70 | — | -$2,325,082,689 | +$14,183,105,391 | — | -0.1% | +0.6% | 3,366,270,000,000 | — | — | Australia | Forex | |||||
| ☆ | 24 | Nickel NICKEL | Commodity | $2,243,150,000,000 | $17,255.00 | — | -$7,878,600,100 | -$7,150,000,000 | — | -0.3% | -0.3% | 130,000,000 | — | — | Global | Commodities | |||||
| ☆ | 25 | New Taiwan dollar TWDUSD=X | Currency | $2,092,440,846,871 | $0.03 | — | -$129,197,493 | +$1,678,076,152 | — | -0.0% | +0.1% | 67,784,624,000,000 | — | — | Taiwan | Forex | |||||
| ☆ | 26 | Uranium URANIUM | Commodity | $2,078,896,033,900 | $190,920.32 | — | — | +$13,203,150,331 | — | — | +0.6% | 10,888,815 | — | — | Global | Commodities | |||||
| ☆ | 27 | Canadian dollar CADUSD=X | Currency | $1,982,118,137,963 | $0.71 | — | -$1,570,319,190 | +$10,685,507,913 | — | -0.1% | +0.5% | 2,779,326,000,000 | — | — | Canada | Forex | |||||
| ☆ | 28 | Taiwan Semiconductor Manufacturing Comp. 2330.TW | Company | $1,941,225,319,463 | $68.07 | — | — | -$174,376,846,302 | — | — | -8.2% | 25,932,370,067 | $4,358,926,114 | 0.22% | Taiwan | Technology | |||||
| ☆ | 29 | Broadcom AVGO | Company | $1,852,030,844,928 | $388.23 | — | +$1,860,474,537 | +$35,492,129,630 | — | +0.1% | +2.0% | 4,757,580,198 | $7,916,399,095 | 0.43% | United States | Technology | |||||
| ☆ | 30 | Saudi Aramco 2222.SR | Company | $1,711,991,773,443 | $7.08 | — | +$7,723,271,158 | -$683,948,297 | — | +0.5% | -0.0% | 241,907,400,000 | $47,980,480 | 0.00% | Saudi Arabia | Energy | |||||
| ☆ | 31 | Russian ruble RUBUSD=X | Currency | $1,611,933,286,642 | $0.01 | — | +$13,400,931,146 | -$33,182,277,766 | — | +0.8% | -2.0% | 127,866,600,000,000 | — | — | Russia | Forex | |||||
| ☆ | 32 | Brazilian real BRLUSD=X | Currency | $1,441,283,325,988 | $0.20 | — | -$1,875,998,386 | +$113,499,512 | — | -0.1% | +0.0% | 7,317,828,000,000 | — | — | Brazil | Forex | |||||
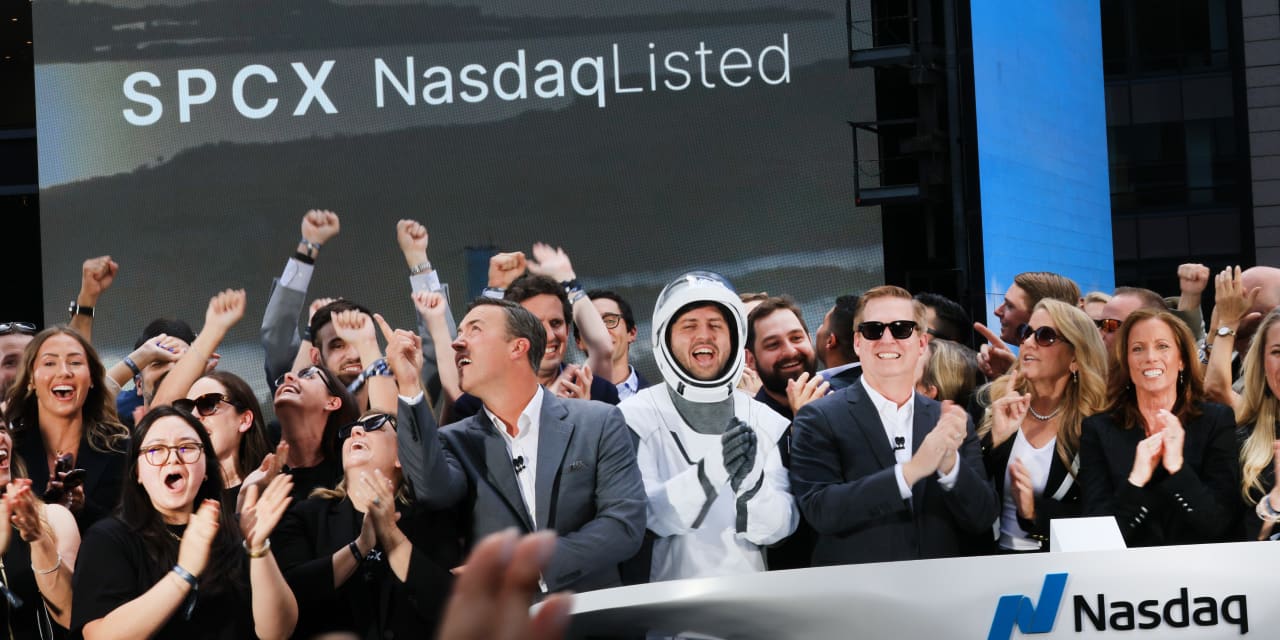
| ☆ | 33 | SpaceX SPCX | Company | $1,427,686,686,720 | $117.16 | — | +$60,441,437,587 | -$40,334,951,631 | — | +4.4% | -2.7% | 7,571,396,888 | $6,893,192,135 | 0.48% | United States | Industrials | |||||
| ☆ | 34 | Meta Platforms META | Company | $1,418,222,239,744 | $594.66 | — | +$132,673,634,004 | -$18,220,862,193 | — | +10.3% | -1.3% | 2,205,128,509 | $14,427,318,020 | 1.02% | United States | Communication Services | |||||
| ☆ | 35 | Swiss franc CHFUSD=X | Currency | $1,364,248,693,618 | $1.24 | — | -$5,407,506,653 | +$17,994,377,875 | — | -0.4% | +1.3% | 1,102,313,000,000 | — | — | Switzerland | Forex | |||||
| ☆ | 36 | Bitcoin BTC-USD | Cryptocurrency | $1,269,831,039,472 | $63,284.00 | +$642,099,002 | +$13,816,163,634 | -$40,231,515,614 | +0.1% | +1.1% | -3.1% | 20,064,840 | $63,080,921,562 | 4.97% | Global | Cryptocurrency | |||||
| ☆ | 37 | Tesla TSLA | Company | $1,229,138,690,048 | $300.64 | — | -$33,565,821,731 | -$54,621,117,945 | — | -2.7% | -4.3% | 3,949,547,394 | $11,012,611,558 | 0.90% | United States | Consumer Cyclical | |||||
| ☆ | 38 | Samsung Electronics 005930.KS | Company | $1,199,361,875,419 | $144.03 | — | — | -$340,150,083,623 | — | — | -22.1% | 5,764,191,903 | — | — | South Korea | Technology | |||||
| ☆ | 39 | Berkshire Hathaway BRK-B | Company | $1,103,317,041,152 | $511.88 | — | +$4,741,926,800 | — | — | +0.4% | — | 1,398,308,677 | $1,290,514,489 | 0.12% | United States | Financial Services | |||||
| ☆ | 40 | Mexican peso MXNUSD=X | Currency | $946,479,579,922 | $0.06 | — | -$1,600,574,516 | +$8,056,227,802 | — | -0.2% | +0.9% | 16,427,100,283,000 | — | — | Mexico | Forex | |||||
| ☆ | 41 | Walmart WMT | Company | $884,938,375,168 | $116.05 | — | +$37,746,186,619 | +$19,292,495,383 | — | +4.5% | +2.2% | 7,958,079,155 | $2,645,840,081 | 0.30% | United States | Consumer Defensive | |||||
| ☆ | 42 | SK hynix 000660.KS | Company | $848,546,311,687 | $919.84 | — | — | -$363,609,584,193 | — | — | -30.0% | 709,854,891 | — | — | South Korea | Technology | |||||
| ☆ | 43 | Zinc ZINC | Commodity | $838,465,000,000 | $3,645.50 | — | +$6,406,847,772 | +$12,845,500,000 | — | +0.8% | +1.6% | 230,000,000 | $190,968 | 0.00% | Global | Commodities | |||||
| ☆ | 44 | Saudi riyal SARUSD=X | Currency | $765,781,755,469 | $0.27 | — | -$224,308,833 | -$305,933,204 | — | -0.0% | -0.0% | 2,876,123,000,000 | — | — | Saudi Arabia | Forex | |||||
| ☆ | 45 | Indian rupee INRUSD=X | Currency | $762,289,706,119 | $0.01 | — | +$2,151,347,943 | +$9,492,750,983 | — | +0.3% | +1.3% | 72,722,440,000,000 | — | — | India | Forex | |||||
| ☆ | 46 | UAE Dirham AEDUSD=X | Currency | $749,836,124,775 | $0.27 | — | -$183,741,692 | -$102,063,413 | — | -0.0% | -0.0% | 2,754,748,000,000 | — | — | United Arab Emirates | Forex | |||||
| ☆ | 47 | Polish złoty PLNUSD=X | Currency | $722,291,215,834 | $0.27 | — | -$1,103,159,650 | +$11,298,611,890 | — | -0.2% | +1.6% | 2,699,852,300,000 | — | — | Poland | Forex | |||||
| ☆ | 48 | Thai baht THBUSD=X | Currency | $720,072,710,323 | $0.03 | — | -$1,510,490,098 | +$5,767,457,170 | — | -0.2% | +0.8% | 24,079,230,000,000 | — | — | Thailand | Forex | |||||
| ☆ | 49 | Singapore dollar SGDUSD=X | Currency | $684,894,251,802 | $0.78 | — | -$1,015,939,714 | +$4,508,770,020 | — | -0.1% | +0.7% | 878,513,800,000 | — | — | Singapore | Forex | |||||
| ☆ | 50 | Visa V | Company | $683,582,029,824 | $366.00 | — | -$504,281,825 | +$19,442,865,930 | — | -0.1% | +2.9% | 1,704,112,694 | $1,782,354,486 | 0.26% | United States | Financial Services | |||||
| ☆ | 51 | Vietnamese đồng VNDUSD=X | Currency | $681,136,306,446 | $0.00 | — | -$570,256,465 | +$853,593,241 | — | -0.1% | +0.1% | 17,914,566,000,000,000 | — | — | Vietnam | Forex | |||||
| ☆ | 52 | Malaysian ringgit MYRUSD=X | Currency | $628,893,024,770 | $0.24 | — | -$2,237,799,303 | +$691,263,974 | — | -0.4% | +0.1% | 2,571,857,930,000 | — | — | Malaysia | Forex | |||||
| ☆ | 53 | ASML Holding N.V ASMLF | Company | $625,645,125,632 | $1,641.76 | — | -$1,890,166,543 | — | — | -0.3% | — | 384,100,000 | $93,580 | 0.00% | Netherlands | Technology | |||||
| ☆ | 54 | ExxonMobil EXXO34.SA | Company | $625,076,940,100 | $19.66 | — | +$12,526,591,986 | — | — | +2.0% | — | 33,159,577,296 | — | — | United States | Energy | |||||
| ☆ | 55 | Lithium LITHIUM | Commodity | $624,954,459,071 | $20,831.82 | — | -$13,079,700,266 | -$19,668,543,488 | — | -2.0% | -3.1% | 30,000,000 | — | — | Global | Commodities | |||||
| ☆ | 56 | Johnson & Johnson JNJ | Company | $617,777,463,296 | $258.10 | — | +$5,457,313,508 | -$12,685,860,347 | — | +0.9% | -2.0% | 2,409,898,597 | $1,174,891,848 | 0.19% | United States | Healthcare | |||||
| ☆ | 57 | Cobalt COBALT | Commodity | $589,919,200,000 | $56,290.00 | — | — | — | — | — | — | 10,480,000 | — | — | Global | Commodities | |||||
| ☆ | 58 | Indonesian rupiah IDRUSD=X | Currency | $561,787,910,838 | $0.00 | — | +$1,958,300,190 | -$999,942,174 | — | +0.3% | -0.2% | 10,117,800,000,000,000 | — | — | Indonesia | Forex | |||||
| ☆ | 59 | Tencent TCEHY | Company | $552,970,027,008 | $61.13 | — | +$5,246,566,590 | +$49,571,008,474 | — | +1.0% | +9.8% | 9,001,629,075 | $39,511,498 | 0.01% | China | Communication Services | |||||
| ☆ | 60 | Swedish krona SEKUSD=X | Currency | $540,629,173,216 | $0.11 | — | +$1,631,808,682 | +$11,570,417,505 | — | +0.3% | +2.2% | 5,146,525,000,000 | — | — | Sweden | Forex | |||||
| ☆ | 61 | Turkish lira TRYUSD=X | Currency | $539,594,004,420 | $0.02 | — | -$1,030,752,121 | -$1,972,785,559 | — | -0.2% | -0.4% | 25,641,237,861,120 | — | — | Turkey | Forex | |||||
| ☆ | 62 | Platinum PL=F | Commodity | $536,917,467,719 | $1,670.00 | — | +$3,150,773,164 | +$15,303,755,367 | — | +0.6% | +2.9% | 321,507,466 | $22,575,060 | 0.00% | Global | Commodities | |||||
| ☆ | 63 | Mastercard MA | Company | $502,041,247,744 | $573.00 | — | -$3,811,307,902 | +$29,614,300,478 | — | -0.8% | +6.3% | 869,464,115 | $2,622,363,723 | 0.52% | United States | Financial Services | |||||
| ☆ | 64 | Israeli new shekel ILSUSD=X | Currency | $482,391,880,127 | $0.33 | — | -$994,281,050 | -$567,677,241 | — | -0.2% | -0.1% | 1,477,518,130,000 | — | — | Israel | Forex | |||||
| ☆ | 65 | Cisco Systems CSCO | Company | $457,166,979,072 | $121.33 | — | +$29,277,074,321 | +$12,057,482,346 | — | +6.8% | +2.7% | 3,941,434,665 | $2,282,464,935 | 0.50% | United States | Technology | |||||
| ☆ | 66 | Intel INTC | Company | $454,968,770,560 | $96.20 | — | +$23,978,083,854 | -$7,519,754,108 | — | +5.6% | -1.6% | 5,044,000,000 | $10,489,600,092 | 2.31% | United States | Technology | |||||
| ☆ | 67 | Industrial and Commercial Bank of China IDCBY | Company | $444,904,243,200 | $19.13 | — | -$7,209,634,887 | +$18,605,509,386 | — | -1.6% | +4.4% | 4,339,702,228 | $19,455 | 0.00% | China | Financial Services | |||||
| ☆ | 68 | AbbVie ABBV | Company | $443,359,002,624 | $252.00 | — | -$9,518,143,667 | -$13,371,144,524 | — | -2.1% | -2.9% | 1,766,792,821 | $1,228,652,460 | 0.28% | United States | Healthcare | |||||
| ☆ | 69 | Costco Wholesale COST | Company | $422,143,066,112 | $952.72 | — | -$642,501,818 | +$8,693,474,428 | — | -0.2% | +2.1% | 443,478,804 | $1,676,972,028 | 0.40% | United States | Consumer Defensive | |||||
| ☆ | 70 | China Construction Bank 601939.SS | Company | $419,064,259,071 | $1.60 | — | -$4,634,812,082 | +$23,785,771,521 | — | -1.1% | +6.0% | 21,183,061,579 | $336,382,075 | 0.08% | China | Financial Services | |||||
| ☆ | 71 | Applied Materials AMAT | Company | $403,069,403,136 | $511.50 | — | +$7,667,365,066 | -$18,439,538,677 | — | +1.9% | -4.4% | 793,959,430 | $3,791,006,290 | 0.94% | United States | Technology | |||||
| ☆ | 72 | Chevron CVX | Company | $392,006,172,672 | $198.50 | — | +$12,224,273,092 | +$7,010,689,738 | — | +3.2% | +1.8% | 1,991,597,732 | $1,965,060,675 | 0.50% | United States | Energy | |||||
| ☆ | 73 | The Coca-Cola KO | Company | $376,860,246,016 | $87.65 | — | -$3,611,666,933 | +$22,787,898,504 | — | -0.9% | +6.4% | 4,302,549,243 | $953,604,040 | 0.25% | United States | Consumer Defensive | |||||
| ☆ | 74 | UnitedHealth UNH | Company | $376,335,040,512 | $414.30 | — | -$6,512,967,030 | -$5,586,436,155 | — | -1.7% | -1.5% | 908,144,404 | $1,141,505,047 | 0.30% | United States | Healthcare | |||||
| ☆ | 75 | Caterpillar CATP34.SA | Company | $375,999,331,869 | $54.33 | — | +$27,901,781,125 | — | — | +8.0% | — | 7,369,471,728 | — | — | United States | Industrials | |||||
| ☆ | 76 | Oracle ORCL | Company | $374,086,762,496 | $129.35 | — | +$5,176,770,815 | +$41,905,815,142 | — | +1.4% | +12.6% | 2,880,471,000 | $3,746,924,524 | 1.00% | United States | Technology | |||||
| ☆ | 77 | GE Aerospace GE | Company | $373,595,144,192 | $360.35 | — | +$5,505,176,122 | — | — | +1.5% | — | 1,037,562,513 | $1,098,571,658 | 0.29% | United States | Industrials | |||||
| ☆ | 78 | General Electric GE.MX | Company | $371,348,830,821 | $363.85 | — | +$5,703,433,117 | — | — | +1.6% | — | 1,037,562,513 | $1,648,243 | 0.00% | United States | Industrials | |||||
| ☆ | 79 | Lam Research LRCX | Company | $366,649,442,304 | $310.59 | — | +$15,192,949,942 | -$7,980,135,323 | — | +4.3% | -2.1% | 1,251,278,000 | $3,901,367,578 | 1.06% | United States | Technology | |||||
| ☆ | 80 | Norwegian krone NOKUSD=X | Currency | $365,731,750,764 | $0.11 | — | +$3,191,892,435 | +$4,031,172,234 | — | +0.9% | +1.1% | 3,468,600,000,000 | — | — | Norway | Forex | |||||
| ☆ | 81 | HSBC HSBA.L | Company | $364,334,146,524 | $2,128.93 | — | -$1,799,522,760 | +$11,064,254,903 | — | -0.5% | +3.1% | 17,148,209,505 | $42,848,042,314 | 11.76% | United Kingdom | Financial Services | |||||
| ☆ | 82 | Roche RO.SW | Company | $353,614,150,891 | $451.73 | — | +$6,006,596,536 | +$9,444,291,415 | — | +1.7% | +2.7% | 106,691,000 | $7,415,643 | 0.00% | Switzerland | Healthcare | |||||
| ☆ | 83 | Czech koruna CZKUSD=X | Currency | $336,202,352,320 | $0.05 | — | -$481,373,175 | +$3,942,835,433 | — | -0.1% | +1.2% | 7,054,533,900,000 | — | — | Czech Republic | Forex | |||||
| ☆ | 84 | Morgan Stanley MS | Company | $330,780,246,016 | $213.88 | — | +$7,686,449,517 | -$927,941,592 | — | +2.4% | -0.3% | 1,572,000,000 | $1,009,310,842 | 0.31% | United States | Financial Services | |||||
| ☆ | 85 | Philippine peso PHPUSD=X | Currency | $314,630,344,947 | $0.02 | — | +$1,258,158,965 | +$3,000,836,169 | — | +0.4% | +1.0% | 19,277,402,700,000 | — | — | Philippines | Forex | |||||
| ☆ | 86 | Novartis NOVNEE.SW | Company | $304,703,918,742 | $157.60 | — | — | +$4,538,511,476 | — | — | +1.5% | — | $20,527,270 | 0.01% | Switzerland | ||||||
| ☆ | 87 | PetroChina 601857.SS | Company | $299,400,929,176 | $1.64 | — | -$4,859,528,156 | +$2,369,746,715 | — | -1.6% | +0.8% | 161,922,077,818 | $266,932,938 | 0.09% | China | Energy | |||||
| ☆ | 88 | Netflix NFLX | Company | $298,596,106,240 | $75.00 | — | +$7,285,744,992 | — | — | +2.5% | — | 4,163,939,676 | $2,688,558,900 | 0.90% | United States | Communication Services | |||||
| ☆ | 89 | Philip Morris PM | Company | $297,414,623,232 | $193.55 | — | +$2,381,775,593 | — | — | +0.8% | — | 1,558,613,439 | $1,053,329,874 | 0.35% | United States | Consumer Defensive | |||||
| ☆ | 90 | Palantir Technologies PLTR | Company | $295,013,220,352 | $123.31 | — | +$2,512,086,258 | -$135,628,087,436 | — | +0.9% | -31.5% | 2,296,071,334 | $3,586,479,735 | 1.22% | United States | Technology | |||||
| ☆ | 91 | Alibaba BABA | Company | $293,017,616,384 | $121.80 | — | +$13,183,387,010 | — | — | +4.7% | — | 2,396,872,232 | $2,062,521,371 | 0.70% | China | Consumer Cyclical | |||||
| ☆ | 92 | Royal Bank of Canada RY.TO | Company | $290,786,513,883 | $209.67 | — | -$365,955,817 | — | — | -0.1% | — | 1,389,662,335 | $536,544,978 | 0.18% | Canada | Financial Services | |||||
| ☆ | 93 | RTX RTX | Company | $290,064,498,688 | $217.00 | — | +$3,502,161,228 | — | — | +1.2% | — | 1,347,758,144 | $740,703,460 | 0.26% | United States | Industrials | |||||
| ☆ | 94 | Danish krone DKKUSD=X | Currency | $289,559,201,429 | $0.15 | — | -$70,989,269 | +$4,054,238,492 | — | -0.0% | +1.4% | 1,878,023,000,000 | — | — | Denmark | Forex | |||||
| ☆ | 95 | South African rand ZARUSD=X | Currency | $289,250,976,389 | $0.06 | — | -$395,438,533 | — | — | -0.1% | — | 4,788,203,000,000 | — | — | South Africa | Forex | |||||
| ☆ | 96 | Bank of China 601988.SS | Company | $288,288,537,099 | $0.89 | — | -$3,805,789,269 | — | — | -1.3% | — | 238,590,135,419 | $480,216,685 | 0.17% | China | Financial Services | |||||
| ☆ | 97 | Colombian peso COPUSD=X | Currency | $288,206,235,105 | $0.00 | — | -$7,449,770,635 | +$1,493,892,911 | — | -2.5% | +0.5% | 923,729,880,000,000 | — | — | Colombia | Forex | |||||
| ☆ | 98 | Agricultural Bank of China ACGBY | Company | $280,966,365,184 | $20.12 | — | -$8,518,363,954 | — | — | -2.9% | — | 1,229,552,924 | $25,331 | 0.00% | China | Financial Services | |||||
| ☆ | 99 | Egyptian pound EGPUSD=X | Currency | $275,065,449,219 | $0.02 | — | -$970,441,467 | +$856,901,492 | — | -0.4% | +0.3% | 14,083,351,000,000 | — | — | Egypt | Forex | |||||
| ☆ | 100 | Palo Alto Networks PANW | Company | $270,441,431,040 | $338.01 | — | +$9,865,219,505 | — | — | +3.8% | — | 815,000,000 | $1,699,427,749 | 0.63% | United States | Technology |