The global leaderboard of wealth: $1.2 Quadrillion of Assets ranked by Market Cap
| ☆ | +/- | Asset Name | Type | Market Cap ($) | Price ($) | Market Cap 1Hr Δ ($) |
Market Cap 24Hr Δ ($) |
Market Cap 7d Δ ($) |
1Hr Change | 24Hr Change | 7d Change | Circ. Supply Max. Supply |
24Hr Volume | 24Hr Vol / Mkt Cap (%) |
Last 30 Days | Country | Sector | ||||
|---|---|---|---|---|---|---|---|---|---|---|---|---|---|---|---|---|---|---|---|---|---|
| ☆ | 11 |  |
Nvidia NVDA | Company | $4,653,442,228,882 | $191.13 | — | -$33,598,607,376 | +$84,240,783,463 | — | -0.7% | +1.8% | 24,347,000,000 | $34,305,829,011 | 0.74% | 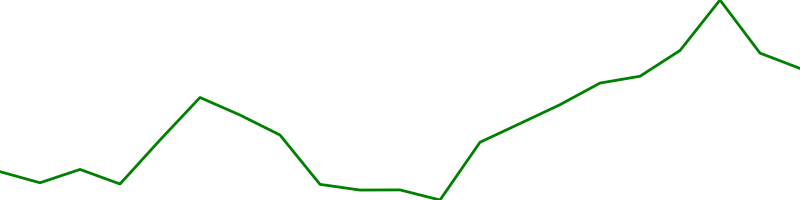 |
United States | Information Technology | |||
| ☆ | 14 |  |
Alphabet GOOGL | Company | $4,093,897,335,372 | $338.00 | — | -$3,028,030,574 | +$121,969,160,212 | — | -0.1% | +3.1% | 12,112,122,294 | $10,486,112,000 | 0.26% | 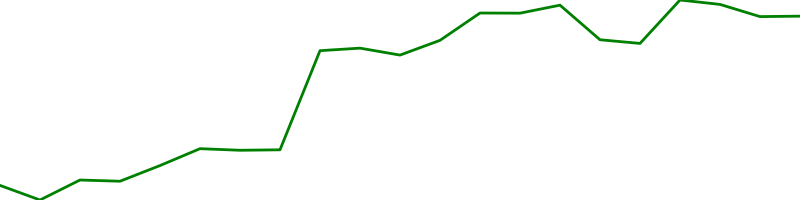 |
United States | Communication Services | |||
| ☆ | 15 |  |
Apple AAPL | Company | $3,850,784,560,241 | $259.48 | — | +$17,808,649,157 | +$169,774,324,278 | — | +0.5% | +4.6% | 14,840,390,000 | $23,987,214,448 | 0.62% | 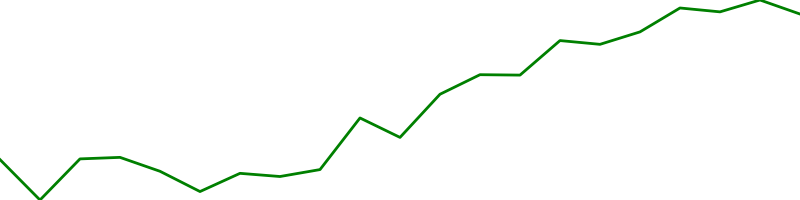 |
United States | Information Technology | |||
| ☆ | 16 |  |
Microsoft MSFT | Company | $3,195,173,998,563 | $430.29 | — | -$23,836,205,883 | -$264,797,960,044 | — | -0.7% | -7.7% | 7,425,629,076 | $25,200,708,872 | 0.79% | 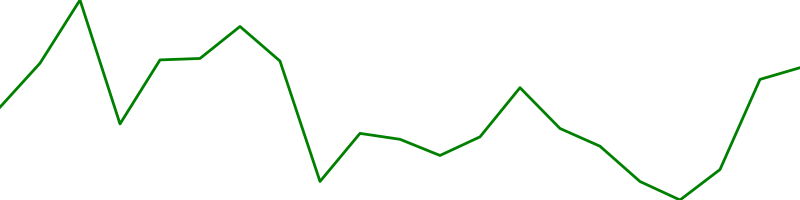 |
United States | Information Technology | |||
| ☆ | 19 |  |
Amazon AMZN | Company | $2,558,168,724,056 | $239.30 | — | -$25,977,146,609 | +$1,496,623,717 | — | -1.0% | +0.1% | 10,690,216,011 | $11,147,790,642 | 0.44% | 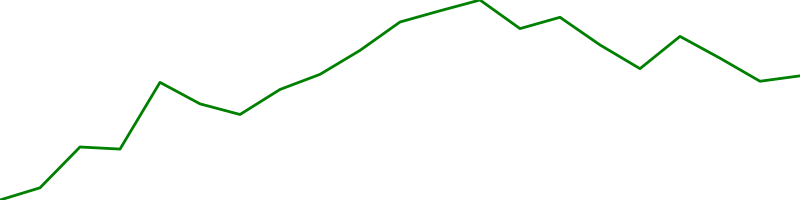 |
United States | Consumer Discretionary | |||
| ☆ | 23 |  |
Meta Platforms META | Company | $1,812,426,489,956 | $716.50 | — | -$55,169,598,494 | +$146,056,507,789 | — | -3.0% | +8.8% | 2,529,555,464 | $17,013,005,900 | 0.94% | 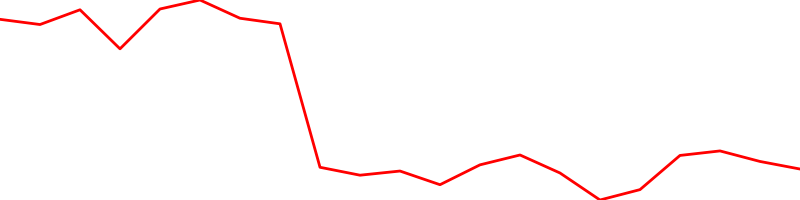 |
United States | Communication Services | |||
| ☆ | 25 |  |
Taiwan Semiconductor Manufacturing TSM | Company | $1,714,457,064,596 | $330.56 | — | -$46,626,792,055 | -$22,353,901,916 | — | -2.6% | -1.3% | 5,186,523,104 | $3,976,008,707 | 0.23% | 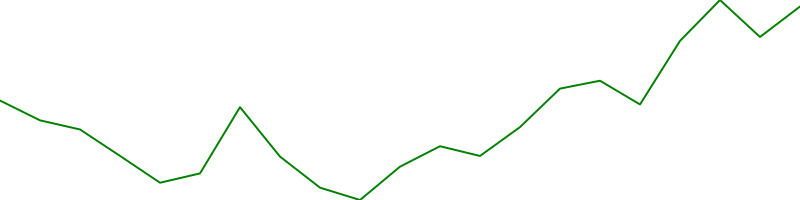 |
Taiwan | Technology | |||
| ☆ | 27 |  |
Saudi Arabian Oil 2222.SR | Company | $1,665,652,628,263 | $6.89 | — | +$10,329,619,157 | +$36,029,775,666 | — | +0.6% | +2.2% | 241,854,700,000 | $150,605,756 | 0.01% | 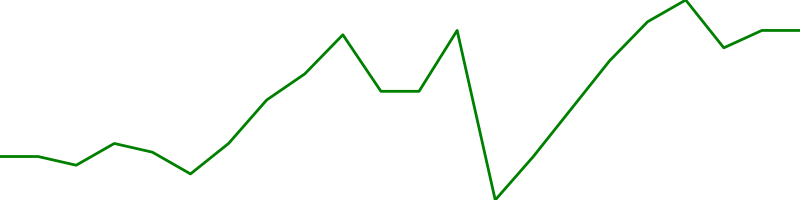 |
Saudi Arabia | Energy minerals | |||
| ☆ | 28 |  |
Tesla TSLA | Company | $1,615,084,263,975 | $430.41 | — | +$51,971,205,881 | -$69,982,833,599 | — | +3.3% | -4.2% | 3,752,431,984 | $35,563,100,004 | 2.20% | 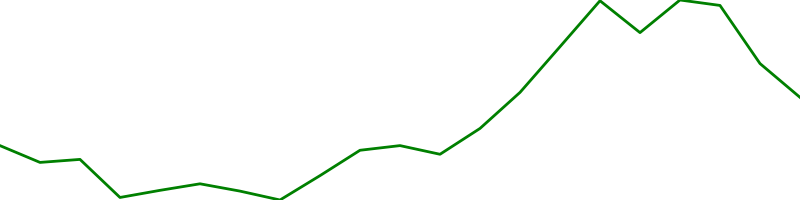 |
United States | Consumer Discretionary | |||
| ☆ | 29 |  |
Broadcom AVGO | Company | $1,564,519,474,143 | $331.30 | — | +$2,691,638,535 | +$53,126,606,498 | — | +0.2% | +3.5% | 4,722,365,022 | $9,380,096,554 | 0.60% | 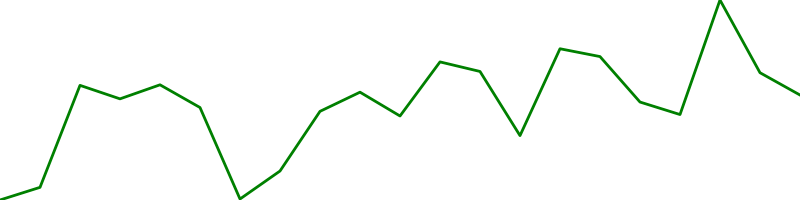 |
United States | Information Technology | |||
| ☆ | 32 |  |
Berkshire Hathaway BRK-B | Company | $1,036,664,062,862 | $480.53 | — | +$8,068,410,882 | +$3,365,436,937 | — | +0.8% | +0.3% | 2,157,334,746 | $2,442,149,560 | 0.24% |  |
United States | Financials | |||
| ☆ | 34 |  |
Walmart WMT | Company | $949,885,477,809 | $119.14 | — | +$13,792,998,377 | +$11,241,688,451 | — | +1.5% | +1.2% | 7,972,851,122 | $2,646,742,742 | 0.28% | 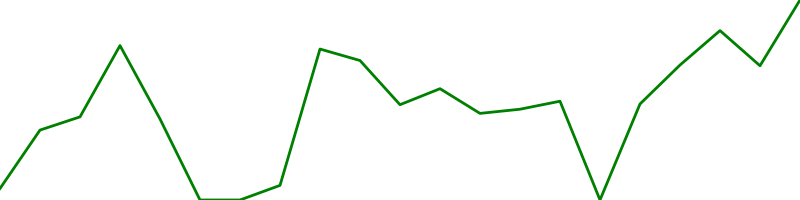 |
United States | Consumer Services | |||
| ☆ | 35 |  |
Eli Lilly and LLY | Company | $929,760,149,483 | $1,037.15 | — | +$11,662,911,189 | -$24,329,849,571 | — | +1.3% | -2.6% | 896,456,759 | $3,425,810,246 | 0.37% | 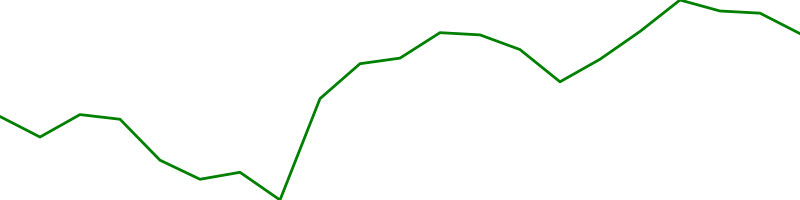 |
United States | Health Care | |||
| ☆ | 36 |  |
JP Morgan Chase JPM | Company | $832,712,853,600 | $305.89 | — | -$1,442,795,694 | +$22,240,919,512 | — | -0.2% | +2.7% | 2,722,262,296 | $3,656,364,523 | 0.44% | 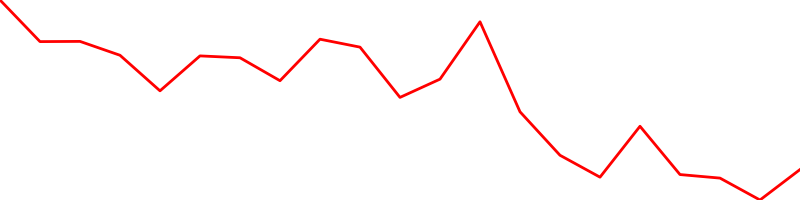 |
United States | Finance | |||
| ☆ | 37 |  |
SAMSUNG ELECTRONICS SMSNN.MX | Company | $825,976,851,177 | $2,438.93 | — | — | +$11,486,474,035 | — | — | +1.4% | 338,663,670 | — | — |  |
South Korea | Technology | |||
| ☆ | 43 |  |
Tencent TCTZF | Company | $711,591,420,021 | $78.88 | — | -$5,232,306,554 | -$6,044,249,418 | — | -0.7% | -0.8% | 9,021,189,716 | $315,520 | 0.00% |  |
China | Communication Services | |||
| ☆ | 48 |  |
Visa V | Company | $621,098,778,054 | $321.83 | — | -$19,241,077,071 | -$8,395,064,438 | — | -3.0% | -1.3% | 1,929,897,163 | $3,604,206,203 | 0.58% | 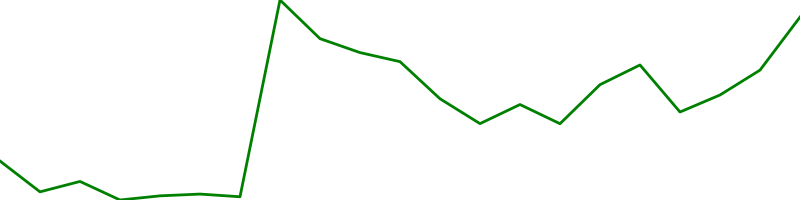 |
United States | Miscellaneous | |||
| ☆ | 49 |  |
Exxon Mobil XOM | Company | $602,823,102,890 | $141.40 | — | +$3,794,287,248 | +$27,412,647,127 | — | +0.6% | +4.8% | 4,263,247,022 | $4,193,598,599 | 0.70% | 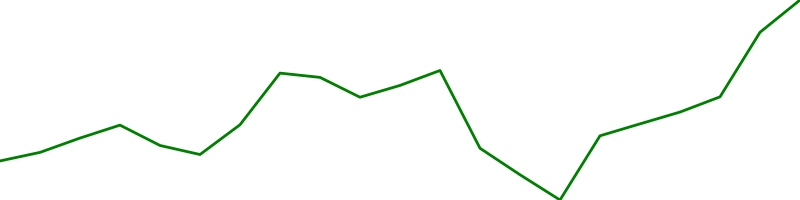 |
United States | Energy | |||
| ☆ | 50 |  |
AstraZeneca AZN | Company | $575,279,190,382 | $185.54 | — | +$1,116,206,032 | -$1,116,206,032 | — | +0.2% | -0.2% | 3,100,567,054 | $515,337,331 | 0.09% |  |
United Kingdom | Healthcare | |||
| ☆ | 53 |  |
ASML Holding N.V. - New York Re ASML | Company | $552,334,140,102 | $1,423.00 | — | -$12,482,842,463 | +$13,181,479,847 | — | -2.2% | +2.4% | 388,147,674 | $3,356,572,400 | 0.61% | 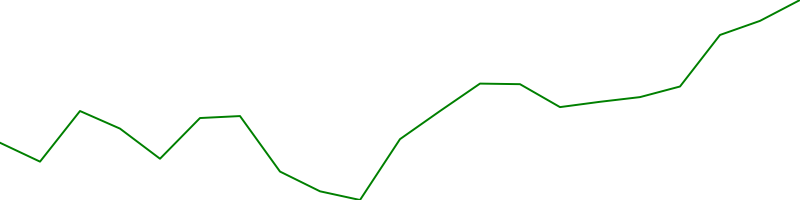 |
Netherlands | Technology | |||
| ☆ | 54 |  |
ASML Holding N.V ASMLF | Company | $551,212,387,638 | $1,420.11 | — | -$15,475,445,867 | +$13,728,781,334 | — | -2.7% | +2.6% | 388,147,674 | $710,055 | 0.00% | 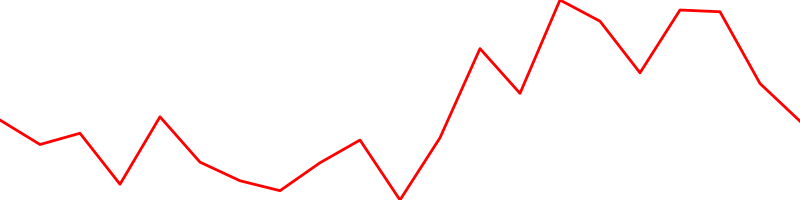 |
Netherlands | Technology | |||
| ☆ | 56 |  |
Johnson & Johnson JNJ | Company | $547,512,311,930 | $227.25 | — | -$96,355,628 | +$17,130,089,646 | — | -0.0% | +3.2% | 2,409,295,102 | $2,510,089,875 | 0.46% | 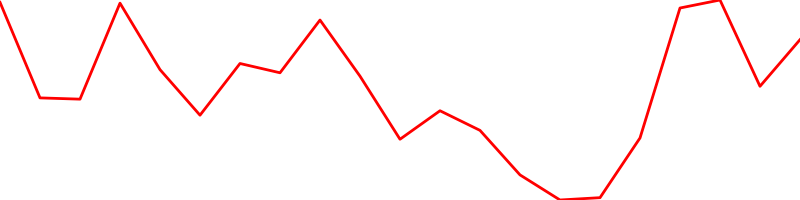 |
United States | Health Care | |||
| ☆ | 58 |  |
Mastercard MA | Company | $481,375,259,894 | $538.79 | — | -$4,413,584,246 | +$12,552,788,287 | — | -0.9% | +2.7% | 893,437,665 | $2,320,514,556 | 0.48% | 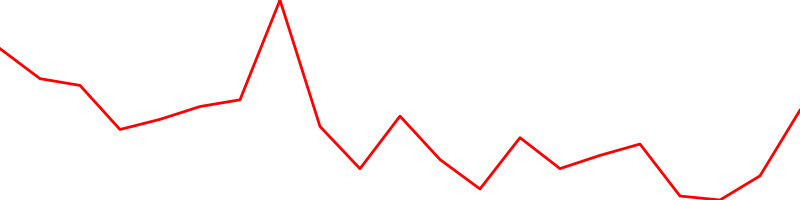 |
United States | Miscellaneous | |||
| ☆ | 59 |  |
Oracle ORCL | Company | $469,183,452,151 | $164.58 | — | -$12,628,990,360 | -$35,862,976,191 | — | -2.6% | -7.1% | 2,850,792,605 | $4,503,303,842 | 0.96% | 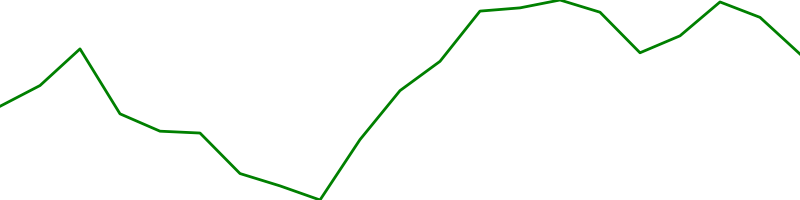 |
United States | Technology | |||
| ☆ | 60 |  |
Micron Technology MU | Company | $466,951,287,699 | $414.88 | — | -$23,534,402,769 | +$17,141,518,410 | — | -4.8% | +3.8% | 1,125,509,261 | $21,168,381,001 | 4.53% | 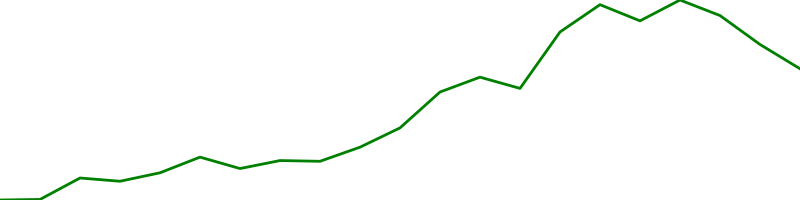 |
United States | Technology | |||
| ☆ | 61 |  |
SK hynix 000660.KS | Company | $439,278,694,261 | $636.22 | — | +$23,196,234,680 | +$77,361,334,687 | — | +5.6% | +21.4% | 690,455,268 | $5,010,325,125 | 1.14% | 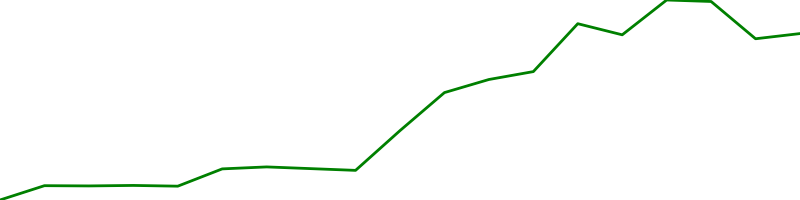 |
South Korea | Technology | |||
| ☆ | 62 |  |
Costco COST | Company | $417,431,211,441 | $940.25 | — | -$5,611,631,616 | -$19,090,180,369 | — | -1.3% | -4.4% | 443,957,683 | $2,253,121,075 | 0.54% | 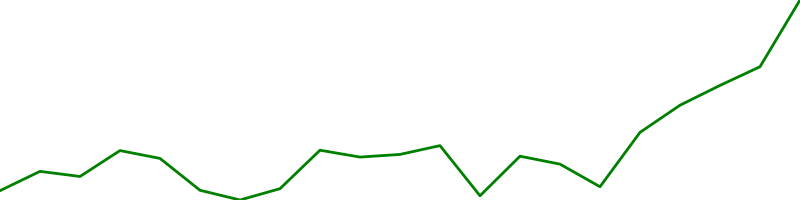 |
United States | Consumer Staples | |||
| ☆ | 63 |  |
TEXAS GULF ENERGY TXGE | Company | $414,153,425,338 | $7,326.25 | — | -$56,283,579,021 | -$62,111,310,310 | — | -12.0% | -13.0% | 56,530,070 | $1,286,488,034,750 | 310.63% | 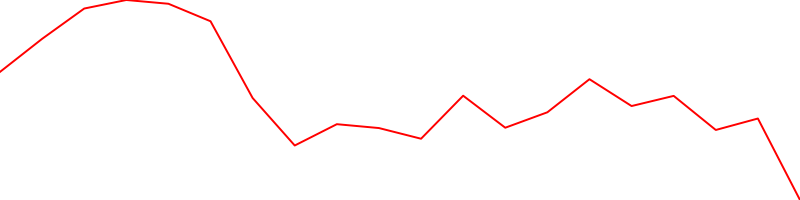 |
United States | Energy | |||
| ☆ | 64 |  |
Alibaba BABA | Company | $404,794,725,201 | $169.56 | — | -$11,196,557,424 | -$8,761,476,301 | — | -2.7% | -2.1% | 2,387,324,434 | $1,839,064,690 | 0.45% |  |
China | Consumer Services | |||
| ☆ | 65 |  |
AbbVie ABBV | Company | $394,144,437,074 | $223.01 | — | +$4,559,855,587 | +$6,627,692,370 | — | +1.2% | +1.7% | 1,767,384,632 | $1,476,816,786 | 0.37% | 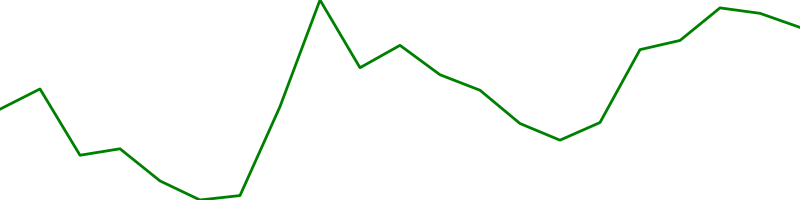 |
United States | Health Care | |||
| ☆ | 66 |  |
Bank of America BAC | Company | $388,492,768,831 | $53.20 | — | +$876,291,666 | +$10,807,690,071 | — | +0.2% | +2.9% | 7,302,495,550 | $1,838,012,146 | 0.47% | 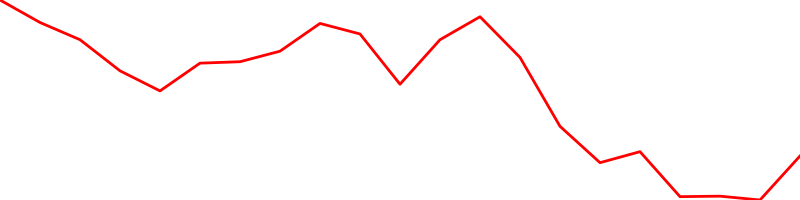 |
United States | Finance | |||
| ☆ | 67 |  |
Advanced Micro Devices AMD | Company | $385,406,266,808 | $236.73 | — | -$25,153,236,825 | -$37,363,548,375 | — | -6.1% | -8.8% | 1,628,041,540 | $9,477,651,090 | 2.46% | 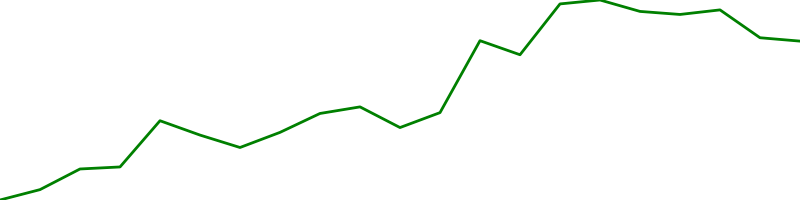 |
United States | Information Technology | |||
| ☆ | 68 |  |
Home Depot HD | Company | $372,908,643,520 | $374.59 | — | +$2,767,520,713 | -$9,138,788,141 | — | +0.7% | -2.4% | 995,511,485 | $1,406,810,190 | 0.38% | 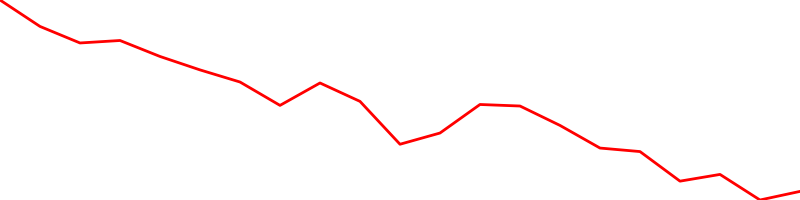 |
United States | Consumer Services | |||
| ☆ | 70 |  |
Roche RHHBY | Company | $361,527,996,088 | $56.75 | — | -$1,720,048,008 | +$9,683,219,728 | — | -0.5% | +2.8% | 6,370,537,376 | $208,221,425 | 0.06% |  |
Switzerland | Healthcare | |||
| ☆ | 71 |  |
Chevron CVX | Company | $356,422,066,017 | $176.90 | — | +$11,504,618,550 | +$20,510,877,031 | — | +3.3% | +6.1% | 2,014,822,376 | $4,059,253,400 | 1.14% | 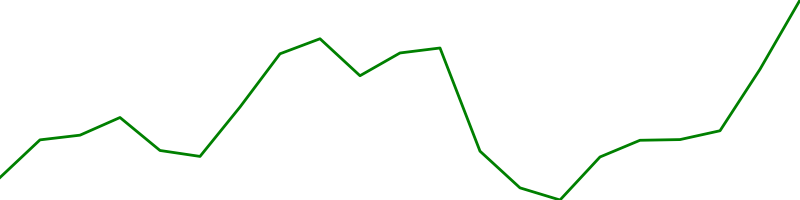 |
United States | Energy | |||
| ☆ | 72 |  |
Procter & Gamble PG | Company | $355,215,458,213 | $151.77 | — | +$4,376,731,725 | +$3,791,610,409 | — | +1.2% | +1.1% | 2,340,485,262 | $1,920,103,032 | 0.54% | 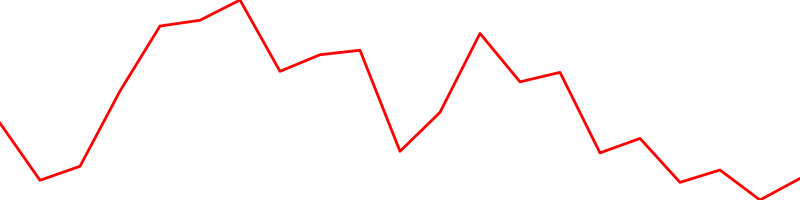 |
United States | Consumer Non-Durables | |||
| ☆ | 73 |  |
Netflix NFLX | Company | $354,155,356,231 | $83.49 | — | +$1,399,798,982 | -$11,156,190,442 | — | +0.4% | -3.1% | 4,241,889,631 | $3,820,084,852 | 1.08% |  |
United States | Communication Services | |||
| ☆ | 74 |  |
Palantir Technologies PLTR | Company | $349,387,924,059 | $146.59 | — | -$12,560,719,684 | -$54,842,893,413 | — | -3.5% | -13.6% | 2,383,436,338 | $6,929,455,717 | 1.98% | 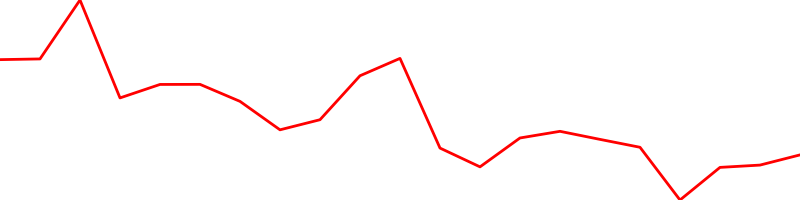 |
United States | Technology | |||
| ☆ | 75 |  |
Agricultural Bank of China 601288.SS | Company | $338,498,255,430 | $0.97 | — | -$3,022,327,083 | -$311,575,214 | — | -0.9% | -0.1% | 349,983,033,873 | $397,676,448 | 0.12% | 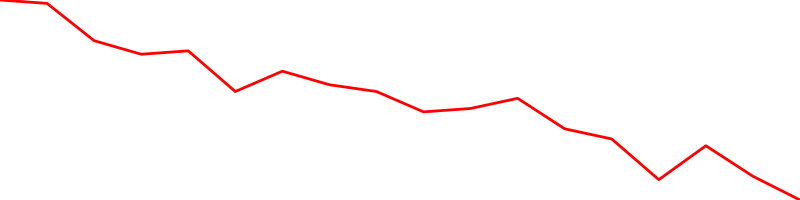 |
China | Financial Services | |||
| ☆ | 79 |  |
General Electric GE | Company | $323,606,368,769 | $306.79 | — | +$8,364,698,779 | +$13,628,209,894 | — | +2.7% | +4.4% | 1,054,813,911 | $2,278,774,825 | 0.70% | 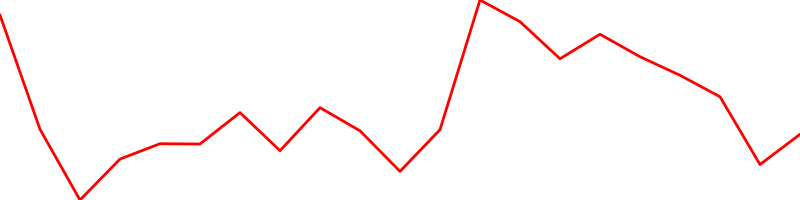 |
United States | Consumer Durables | |||
| ☆ | 80 |  |
LVMH-Moet Hennessy Louis Vuitto LVMHF | Company | $323,509,228,323 | $648.60 | — | -$2,194,647,790 | -$24,435,297,993 | — | -0.7% | -7.0% | 498,780,821 | $1,880,940 | 0.00% |  |
France | Consumer Cyclical | |||
| ☆ | 81 |  |
Coca-Cola KO | Company | $321,957,336,615 | $74.81 | — | +$5,939,048,987 | +$8,306,079,110 | — | +1.9% | +2.6% | 4,303,667,252 | $1,976,517,540 | 0.61% | 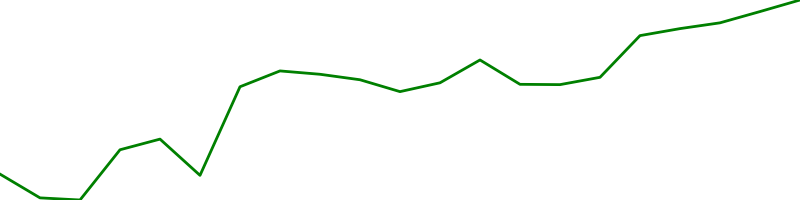 |
United States | Consumer Non-Durables | |||
| ☆ | 82 |  |
Cisco CSCO | Company | $309,449,724,968 | $78.32 | — | -$434,622,813 | +$14,737,595,984 | — | -0.1% | +5.0% | 3,951,094,563 | $2,072,221,880 | 0.67% | 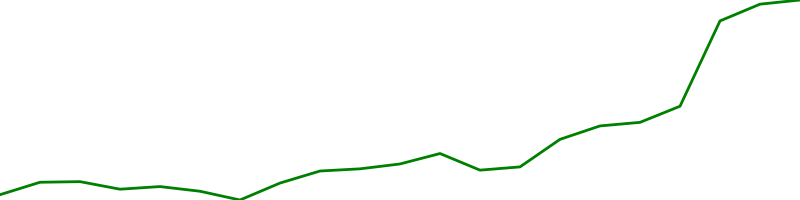 |
United States | Information Technology | |||
| ☆ | 83 |  |
Caterpillar CAT | Company | $307,959,297,961 | $657.36 | — | -$3,691,616,201 | +$14,401,037,518 | — | -1.2% | +4.9% | 468,478,923 | $2,169,353,688 | 0.70% | 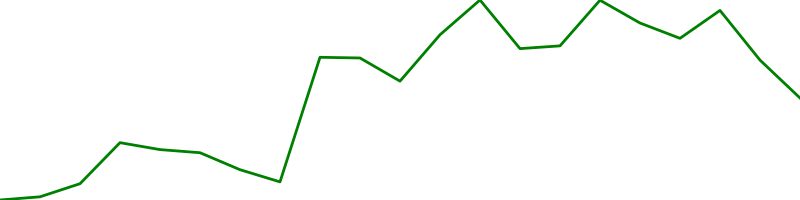 |
United States | Capital Goods | |||
| ☆ | 84 |  |
HSBC HSBC | Company | $302,154,776,458 | $88.01 | — | -$1,819,584,806 | +$13,973,069,175 | — | -0.6% | +4.8% | 3,433,186,787 | $186,413,986 | 0.06% | 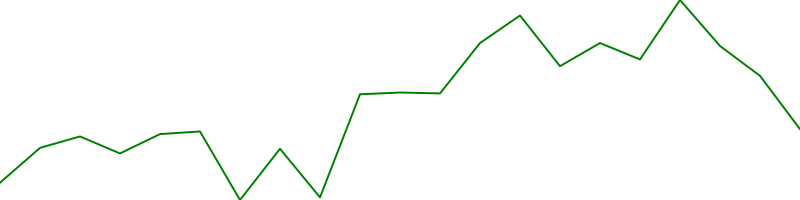 |
United Kingdom | Finance | |||
| ☆ | 85 |  |
Novartis NVSEF | Company | $298,986,136,360 | $151.98 | — | +$19,554,698,045 | +$255,725,073 | — | +7.0% | +0.1% | 1,967,272,962 | $91,188 | 0.00% | 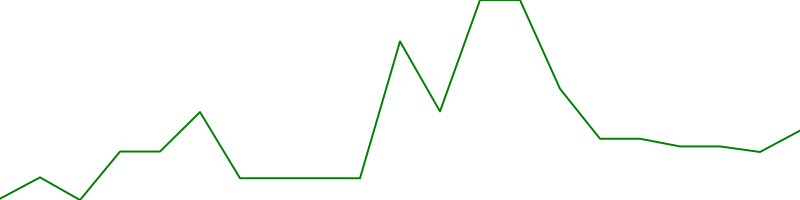 |
Switzerland | Healthcare | |||
| ☆ | 86 |  |
Toyota Motor TM | Company | $297,070,937,136 | $226.86 | — | -$275,001,724 | +$759,506,687 | — | -0.1% | +0.3% | 1,309,490,154 | $79,106,082 | 0.03% |  |
Japan | Capital Goods | |||
| ☆ | 88 |  |
Reelcause RCIT | Company | $293,536,748,165 | $2,245.32 | — | +$103,283,937 | +$1,204,043,033 | — | +0.0% | +0.4% | 130,732,697 | — | — |  |
United States | Industrials | |||
| ☆ | 89 |  |
Lam Research LRCX | Company | $292,100,491,200 | $233.46 | — | -$18,404,847,109 | +$19,418,318,946 | — | -5.9% | +7.1% | 1,251,180,000 | $4,284,668,157 | 1.47% |  |
United States | Technology | |||
| ☆ | 90 |  |
Morgan Stanley R DWD.DE | Company | $288,910,003,892 | $181.78 | — | +$1,939,767,258 | +$4,350,153,391 | — | +0.7% | +1.5% | 1,589,309,311 | $56,171 | 0.00% |  |
United States | Financial Services | |||
| ☆ | 91 |  |
International Business Machines IBM | Company | $286,683,299,091 | $306.70 | — | -$2,374,206,885 | +$13,329,333,166 | — | -0.8% | +4.9% | 934,735,206 | $1,822,012,763 | 0.64% | 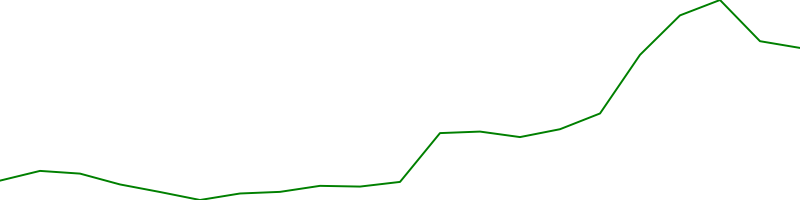 |
United States | Technology | |||
| ☆ | 93 |  |
Wells Fargo WFC | Company | $284,055,753,500 | $90.49 | — | -$470,867,471 | +$11,080,964,601 | — | -0.2% | +4.1% | 3,139,084,542 | $1,656,591,342 | 0.58% |  |
United States | Finance | |||
| ☆ | 94 |  |
Goldman Sachs GS | Company | $283,168,329,473 | $935.41 | — | -$1,425,823,000 | +$5,003,970,059 | — | -0.5% | +1.8% | 302,721,093 | $1,771,385,866 | 0.63% | 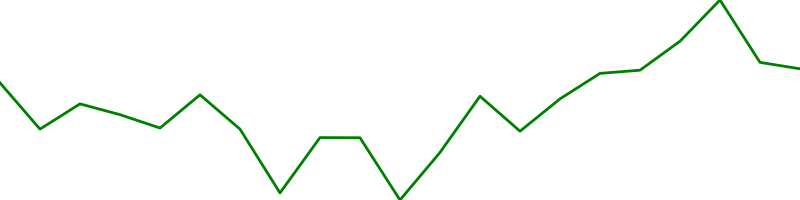 |
United States | Finance | |||
| ☆ | 96 |  |
Philip Morris PM | Company | $279,323,260,921 | $179.44 | — | +$2,412,794,811 | +$9,993,617,918 | — | +0.9% | +3.7% | 1,556,638,749 | $1,478,442,068 | 0.53% | 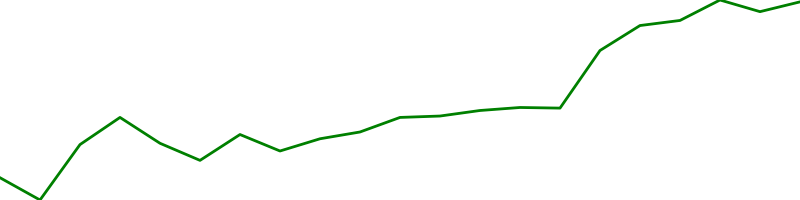 |
United States | Consumer Non-Durables | |||
| ☆ | 97 |  |
PHILIP MRRS INT-WI PMI.SW | Company | $275,286,994,572 | $176.61 | — | -$4,078,325,846 | +$6,603,969,899 | — | -1.5% | +2.5% | 1,558,756,563 | $2,826 | 0.00% |  |
United States | Consumer Defensive | |||
| ☆ | 98 |  |
China Construction Bank CICHY | Company | $269,783,701,140 | $20.19 | — | -$7,081,972,684 | +$8,952,704,089 | — | -2.6% | +3.4% | 13,362,243,388 | $1,118,526 | 0.00% |  |
China | Financial Services | |||
| ☆ | 100 |  |
Raytheon Technologies RTX | Company | $269,401,296,486 | $200.93 | — | +$1,407,794,172 | +$6,703,859,710 | — | +0.5% | +2.6% | 1,340,771,942 | $1,452,402,359 | 0.54% |  |
United States | Capital Goods |