The global leaderboard of wealth: $1.2 Quadrillion of Assets ranked by Market Cap
| ☆ | +/- | Asset Name | Type | Market Cap ($) | Price ($) | Market Cap 1Hr Δ ($) |
Market Cap 24Hr Δ ($) |
Market Cap 7d Δ ($) |
1Hr Change | 24Hr Change | 7d Change | Circ. Supply Max. Supply |
24Hr Volume | 24Hr Vol / Mkt Cap (%) |
Last 30 Days | Country | Sector | ||||
|---|---|---|---|---|---|---|---|---|---|---|---|---|---|---|---|---|---|---|---|---|---|
| ☆ | 12 |  |
Apple AAPL | Company | $2,780,730,570,826 | $173.03 | — | -$2,571,386,914 | +$130,334,200,923 | — | -0.1% | +4.9% | 16,070,800,384 | $9,754,929,544 | 0.35% | 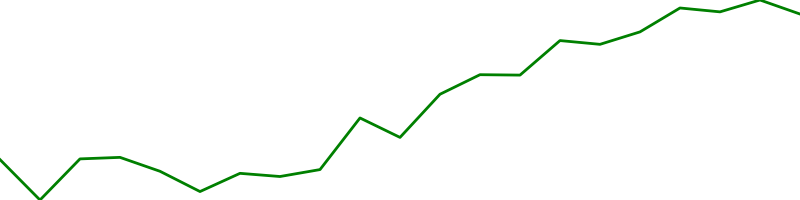 |
United States | Information Technology | |||
| ☆ | 15 |  |
Microsoft MSFT | Company | $2,182,998,857,289 | $292.71 | — | -$5,668,069,073 | +$77,636,660,046 | — | -0.3% | +3.7% | 7,457,889,792 | $5,298,899,704 | 0.24% | 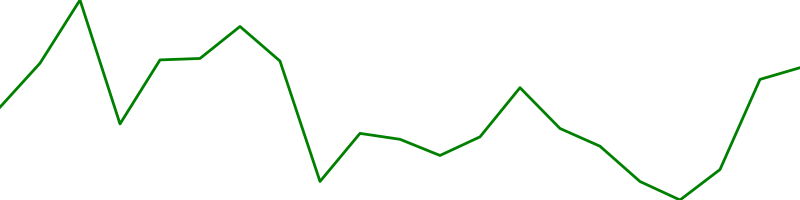 |
United States | Information Technology | |||
| ☆ | 16 |  |
Saudi Arabian Oil 2222.SR | Company | $2,121,692,338,707 | $9.65 | — | -$34,650,918,954 | +$2,002,576,168 | — | -1.6% | +0.1% | 219,911,995,392 | $56,557,595 | 0.00% | 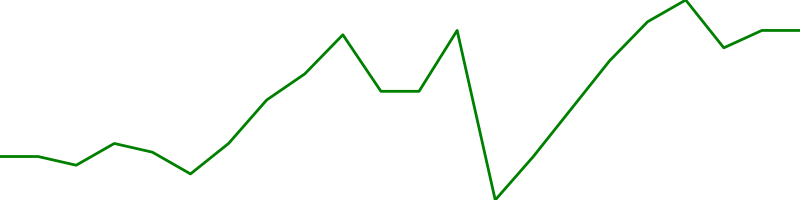 |
Saudi Arabia | Energy minerals | |||
| ☆ | 20 |  |
Alphabet GOOG | Company | $1,592,531,988,407 | $122.51 | — | -$4,809,640,433 | +$65,126,018,487 | — | -0.3% | +4.3% | 12,999,199,744 | $1,914,365,795 | 0.12% |  |
United States | Communication Services | |||
| ☆ | 22 |  |
Amazon AMZN | Company | $1,474,960,697,032 | $144.78 | — | +$16,300,221,975 | +$70,803,788,020 | — | +1.1% | +5.0% | 10,187,599,872 | $8,556,917,790 | 0.58% | 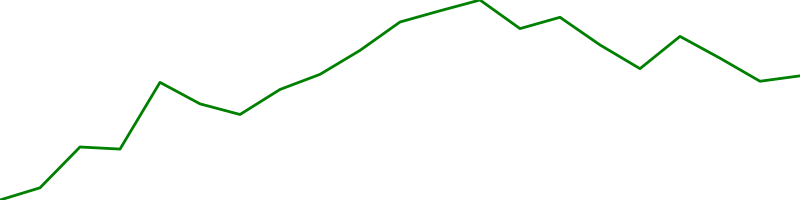 |
United States | Consumer Discretionary | |||
| ☆ | 29 |  |
Berkshire Hathaway BRK-B | Company | $675,510,076,961 | $306.65 | — | +$8,436,962,582 | +$30,575,846,578 | — | +1.3% | +4.7% | 2,202,870,016 | $1,025,008,270 | 0.15% |  |
United States | Financials | |||
| ☆ | 36 |  |
UnitedHealth UNH | Company | $510,831,346,286 | $546.12 | — | +$1,384,348,535 | +$8,287,479,465 | — | +0.3% | +1.6% | 935,382,976 | $968,270,751 | 0.19% | 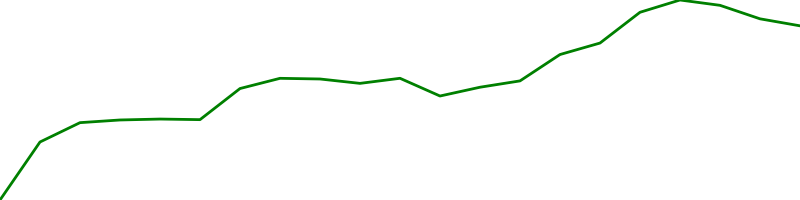 |
United States | Health Care | |||
| ☆ | 40 |  |
Meta Platforms META | Company | $482,334,593,166 | $179.47 | — | -$3,816,316,011 | +$29,401,803,036 | — | -0.8% | +6.5% | 2,687,549,952 | $3,796,992,975 | 0.79% | 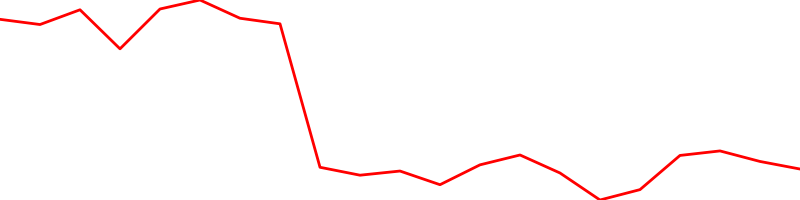 |
United States | Communication Services | |||
| ☆ | 42 |  |
Taiwan Semiconductor Manufacturing TSM | Company | $466,487,857,146 | $89.95 | — | -$8,401,463,429 | +$24,582,006,908 | — | -1.8% | +5.6% | 5,186,079,744 | $950,420,663 | 0.20% | 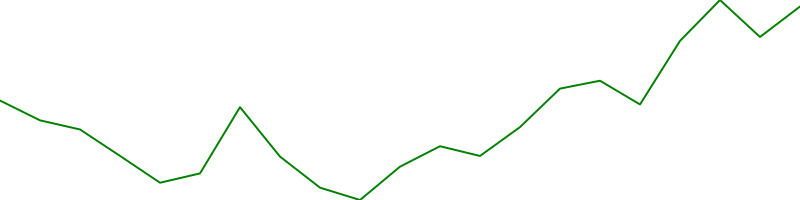 |
Taiwan | Technology | |||
| ☆ | 43 |  |
Visa V | Company | $457,603,016,536 | $217.14 | — | +$1,517,337,807 | +$14,498,991,420 | — | +0.3% | +3.3% | 2,107,410,048 | $1,425,393,812 | 0.31% | 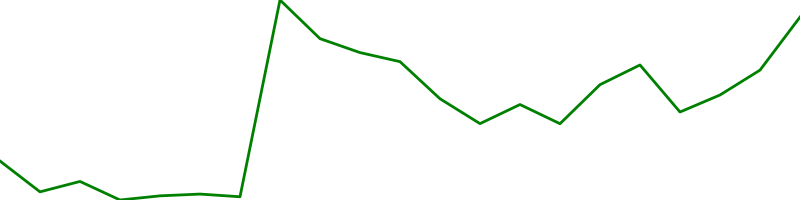 |
United States | Miscellaneous | |||
| ☆ | 45 |  |
Johnson & Johnson JNJ | Company | $440,571,695,770 | $167.57 | — | +$3,891,215,143 | -$6,862,121,036 | — | +0.9% | -1.5% | 2,629,179,904 | $1,248,999,807 | 0.28% | 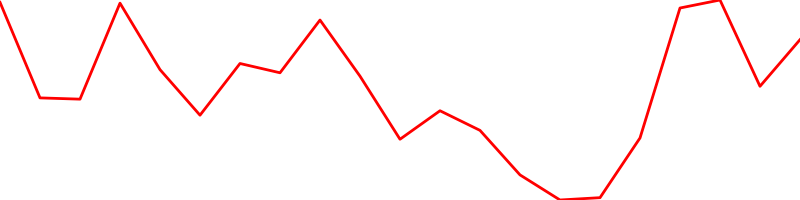 |
United States | Health Care | |||
| ☆ | 46 |  |
AstraZeneca AZN | Company | $417,720,303,158 | $133.48 | — | -$438,122,485 | +$5,320,072,395 | — | -0.1% | +1.3% | 3,129,459,968 | $295,958,521 | 0.07% |  |
United Kingdom | Healthcare | |||
| ☆ | 47 |  |
Exxon Mobil XOM | Company | $381,172,356,438 | $91.46 | — | -$3,584,172,999 | +$3,625,858,302 | — | -0.9% | +1.0% | 4,167,640,064 | $1,283,933,759 | 0.34% | 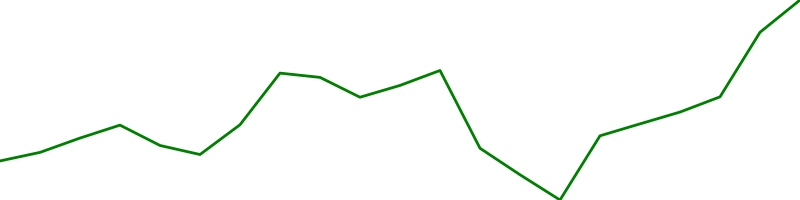 |
United States | Energy | |||
| ☆ | 48 |  |
Tencent TCEHY | Company | $373,290,906,452 | $38.80 | — | +$4,714,220,369 | +$10,101,937,492 | — | +1.3% | +2.8% | 9,620,899,840 | $150,090,037 | 0.04% | 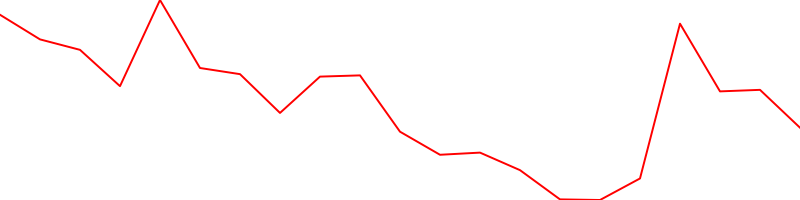 |
China | Communication Services | |||
| ☆ | 49 |  |
JP Morgan Chase JPM | Company | $367,146,483,356 | $123.63 | — | +$3,474,567,037 | +$24,500,190,528 | — | +1.0% | +7.2% | 2,969,720,064 | $1,181,284,624 | 0.32% | 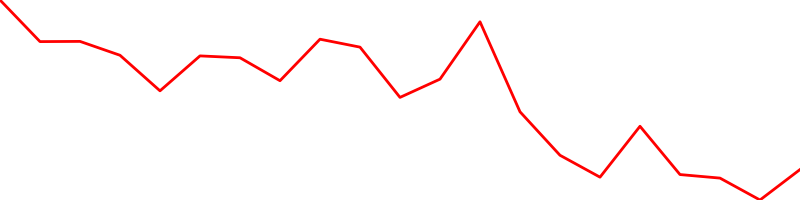 |
United States | Finance | |||
| ☆ | 50 |  |
LVMH-Moet Hennessy Louis Vuitto LVMHF | Company | $358,391,056,800 | $712.50 | — | -$860,149,589 | +$7,333,821,380 | — | -0.2% | +2.1% | 503,004,992 | $427,500 | 0.00% |  |
France | Consumer Cyclical | |||
| ☆ | 51 |  |
Procter & Gamble PG | Company | $358,265,225,993 | $149.93 | — | +$3,273,671,942 | +$11,947,750,400 | — | +0.9% | +3.4% | 2,389,550,080 | $1,063,453,438 | 0.30% | 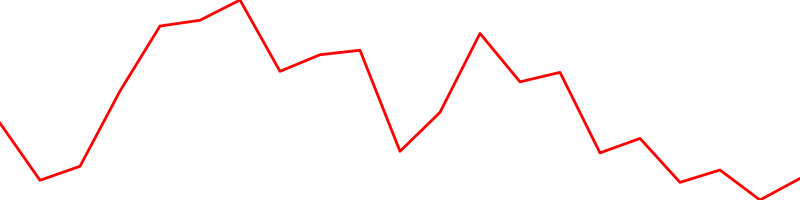 |
United States | Consumer Non-Durables | |||
| ☆ | 52 |  |
Kweichow Moutai 600519.SS | Company | $355,757,615,580 | $283.20 | — | -$380,282,242 | +$294,301,279 | — | -0.1% | +0.1% | 1,256,199,936 | $420,153,107 | 0.12% |  |
China | Consumer Defensive | |||
| ☆ | 53 |  |
Mastercard MA | Company | $347,170,578,000 | $359.25 | — | -$676,474,997 | +$12,282,630,702 | — | -0.2% | +3.7% | 966,376,000 | $879,695,475 | 0.25% | 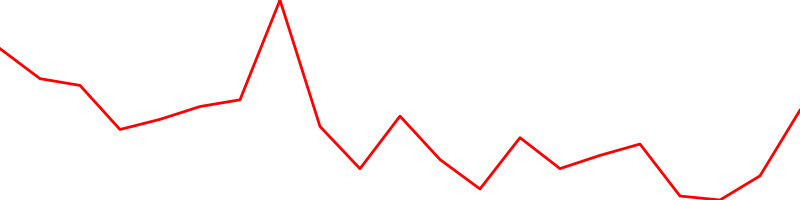 |
United States | Miscellaneous | |||
| ☆ | 54 |  |
Home Depot HD | Company | $337,276,707,668 | $327.38 | — | +$13,156,057,426 | +$22,840,213,288 | — | +4.1% | +7.3% | 1,030,230,016 | $3,303,198,773 | 0.98% | 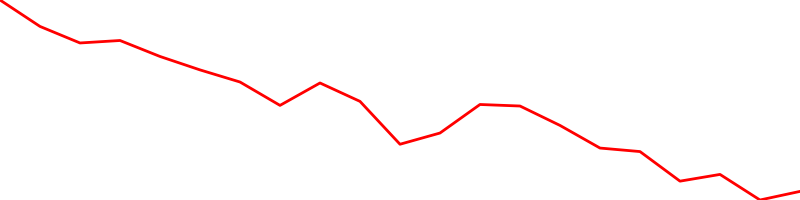 |
United States | Consumer Services | |||
| ☆ | 55 |  |
Nestle S.A NSRGF | Company | $328,548,371,611 | $118.76 | — | -$9,074,084,190 | -$6,058,598,993 | — | -2.7% | -1.8% | 2,766,490,112 | $700,684 | 0.00% |  |
Switzerland | Consumer Defensive | |||
| ☆ | 57 |  |
Tesla TSLA | Company | $320,202,321,353 | $306.56 | — | -$2,879,328,148 | +$24,263,481,928 | — | -0.9% | +8.2% | 1,044,489,984 | $27,019,387,747 | 8.44% | 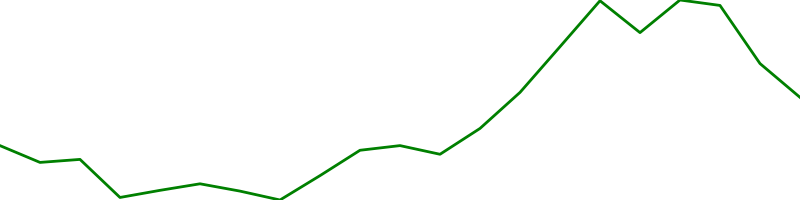 |
United States | Consumer Discretionary | |||
| ☆ | 58 |  |
SAMSUNG ELECTRONICS CO. LTD. R SSU.F | Company | $320,052,794,588 | $1,173.71 | — | +$6,927,549,666 | +$8,609,843,413 | — | +2.2% | +2.8% | 272,684,992 | $2,347 | 0.00% | 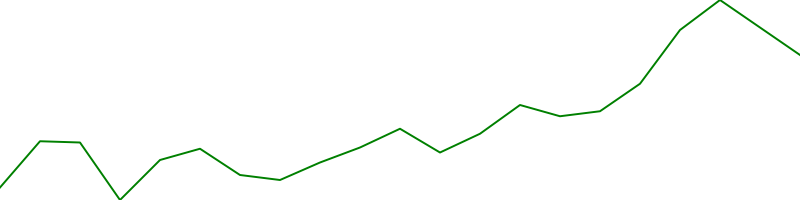 |
South Korea | Technology | |||
| ☆ | 59 |  |
Chevron CVX | Company | $306,161,635,971 | $156.41 | — | -$782,960,059 | +$1,957,430,016 | — | -0.3% | +0.6% | 1,957,430,016 | $1,129,029,970 | 0.37% | 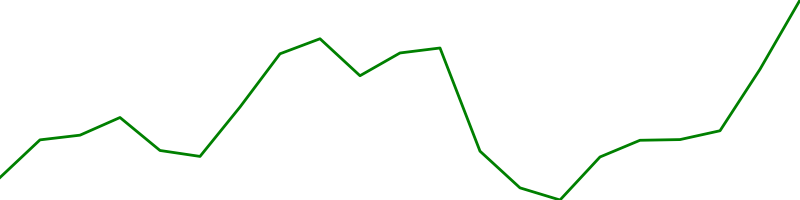 |
United States | Energy | |||
| ☆ | 61 |  |
Bank of America BAC | Company | $296,526,790,468 | $36.64 | — | +$3,156,257,348 | +$22,012,916,088 | — | +1.1% | +8.0% | 8,092,980,224 | $1,167,724,109 | 0.39% | 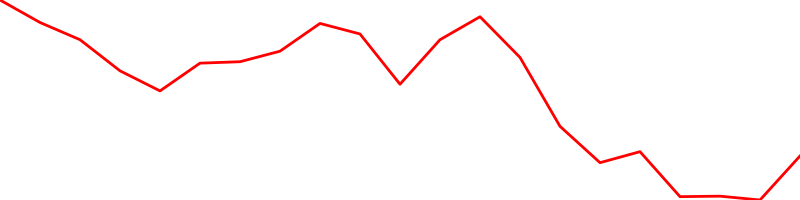 |
United States | Finance | |||
| ☆ | 62 |  |
Eli Lilly and LLY | Company | $294,848,794,483 | $310.31 | — | -$3,449,139,802 | +$6,926,783,694 | — | -1.2% | +2.4% | 950,174,976 | $697,576,875 | 0.24% | 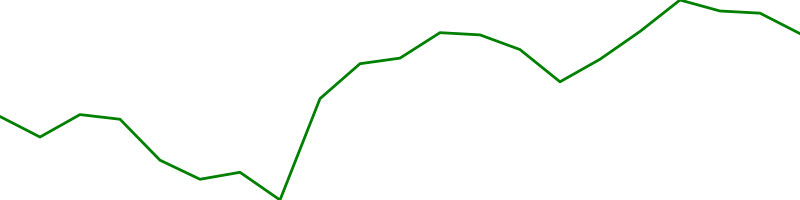 |
United States | Health Care | |||
| ☆ | 64 |  |
Coca-Cola KO | Company | $281,319,783,043 | $65.03 | — | +$2,292,774,787 | +$8,565,478,273 | — | +0.8% | +3.1% | 4,326,000,128 | $622,311,076 | 0.22% | 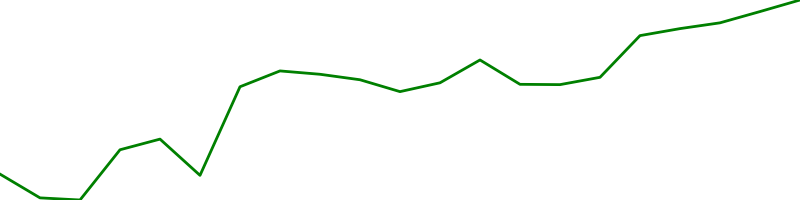 |
United States | Consumer Non-Durables | |||
| ☆ | 65 |  |
Pfizer PFE | Company | $279,759,475,829 | $49.86 | — | +$617,202,421 | +$448,882,271 | — | +0.2% | +0.2% | 5,610,899,968 | $641,937,536 | 0.23% | 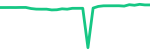 |
United States | Health Care | |||
| ☆ | 66 |  |
Roche RHHBY | Company | $273,491,935,897 | $41.57 | — | -$4,671,133,643 | +$131,584,411 | — | -1.7% | +0.0% | 6,579,069,952 | $49,090,013 | 0.02% |  |
Switzerland | Healthcare | |||
| ☆ | 70 |  |
AbbVie ABBV | Company | $252,591,471,065 | $142.55 | — | +$460,724,292 | +$4,075,490,297 | — | +0.2% | +1.6% | 1,771,949,952 | $549,145,377 | 0.22% | 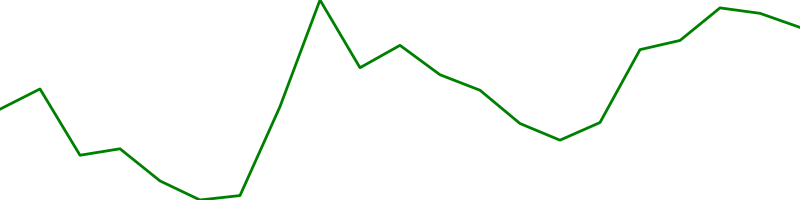 |
United States | Health Care | |||
| ☆ | 71 |  |
PepsiCo PEP | Company | $250,215,642,793 | $180.32 | — | +$1,443,136,624 | +$8,075,958,377 | — | +0.6% | +3.3% | 1,387,619,968 | $612,312,649 | 0.24% |  |
United States | Consumer Staples | |||
| ☆ | 73 |  |
Alibaba BABA | Company | $245,350,178,006 | $92.65 | — | -$4,104,604,927 | +$3,866,282,022 | — | -1.6% | +1.6% | 2,648,140,032 | $1,112,096,498 | 0.45% |  |
China | Consumer Services | |||
| ☆ | 74 |  |
Costco COST | Company | $244,967,411,336 | $553.02 | — | +$3,220,349,720 | +$7,618,969,145 | — | +1.3% | +3.2% | 442,963,008 | $1,381,444,009 | 0.56% | 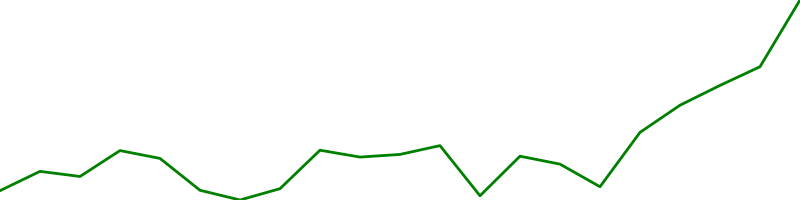 |
United States | Consumer Staples | |||
| ☆ | 76 |  |
Thermo Fisher Scientific TMO | Company | $235,900,064,234 | $602.11 | — | -$932,459,714 | +$8,321,594,364 | — | -0.4% | +3.7% | 391,788,992 | $480,483,768 | 0.20% |  |
United States | Capital Goods | |||
| ☆ | 77 |  |
Walt Disney DIS | Company | $227,809,571,932 | $124.96 | — | +$1,276,136,414 | +$30,682,102,600 | — | +0.6% | +15.6% | 1,823,059,968 | $1,825,328,195 | 0.80% |  |
United States | Consumer Services | |||
| ☆ | 79 |  |
ASML Holding N.V. - New York Re ASML | Company | $225,085,293,091 | $566.68 | — | -$3,280,875,879 | +$10,156,406,909 | — | -1.4% | +4.7% | 397,200,000 | $394,975,955 | 0.18% | 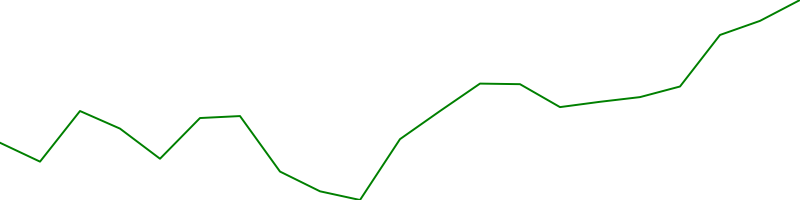 |
Netherlands | Technology | |||
| ☆ | 80 |  |
Toyota Motor TM | Company | $218,207,726,897 | $159.42 | — | -$1,423,522,163 | +$8,869,559,367 | — | -0.6% | +4.2% | 1,368,760,064 | $30,528,930 | 0.01% | 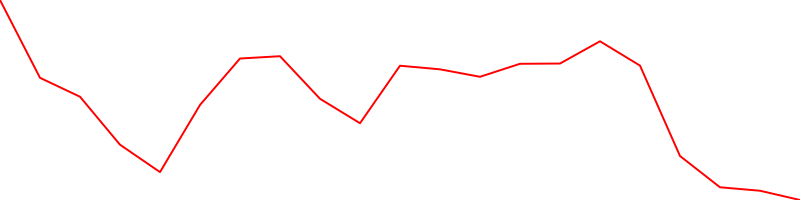 |
Japan | Capital Goods | |||
| ☆ | 81 |  |
Oracle ORCL | Company | $215,182,708,950 | $79.52 | — | +$1,109,457,504 | +$7,441,555,264 | — | +0.5% | +3.6% | 2,706,020,096 | $491,839,131 | 0.23% |  |
United States | Technology | |||
| ☆ | 82 |  |
Adobe ADBE | Company | $211,472,098,846 | $447.56 | — | -$1,634,845,963 | +$9,917,770,386 | — | -0.8% | +4.9% | 472,500,000 | $957,554,615 | 0.45% |  |
United States | Information Technology | |||
| ☆ | 83 |  |
BHP BHP | Company | $210,420,664,266 | $57.97 | — | +$11,724,316,628 | +$14,773,365,902 | — | +5.9% | +7.6% | 3,629,819,904 | $265,763,471 | 0.13% |  |
Australia | Basic Industries | |||
| ☆ | 84 |  |
Accenture plc Class A Ordinary Shares (Ireland) ACN | Company | $202,908,736,403 | $320.78 | — | +$284,654,307 | +$6,951,695,991 | — | +0.1% | +3.5% | 632,547,968 | $511,964,878 | 0.25% |  |
Ireland | Technology | |||
| ☆ | 85 |  |
Danaher DHR | Company | $199,978,746,775 | $266.38 | — | -$1,244,546,720 | +$10,142,678,900 | — | -0.6% | +5.3% | 750,718,976 | $598,105,409 | 0.30% |  |
United States | Health Care | |||
| ☆ | 86 |  |
L'Oreal LRLCY | Company | $198,857,724,647 | $74.10 | — | +$53,663,792 | +$2,146,899,766 | — | +0.0% | +1.1% | 2,683,640,064 | $6,787,560 | 0.00% |  |
France | Consumer Defensive | |||
| ☆ | 88 |  |
Abbott Laboratories ABT | Company | $196,189,170,877 | $112.03 | — | +$227,653,786 | +$7,215,017,717 | — | +0.1% | +3.8% | 1,751,219,968 | $324,595,718 | 0.17% | 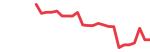 |
United States | Health Care | |||
| ☆ | 89 |  |
McDonald's MCD | Company | $195,914,084,086 | $266.29 | — | +$625,363,934 | +$4,583,524,943 | — | +0.3% | +2.4% | 735,716,992 | $486,778,136 | 0.25% |  |
United States | Consumer Services | |||
| ☆ | 90 |  |
Cisco CSCO | Company | $195,081,410,516 | $46.77 | — | +$750,795,661 | +$7,716,507,428 | — | +0.4% | +4.1% | 4,171,079,936 | $989,358,559 | 0.51% | 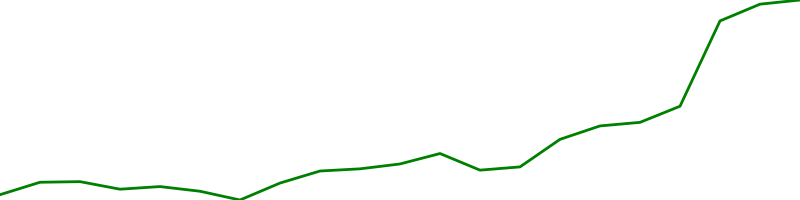 |
United States | Information Technology | |||
| ☆ | 91 |  |
SHELL RYDAF | Company | $194,470,576,666 | $26.10 | — | +$745,100,826 | -$2,458,822,779 | — | +0.4% | -1.2% | 7,450,979,840 | $146,160 | 0.00% |  |
United Kingdom | Energy | |||
| ☆ | 92 |  |
Verizon VZ | Company | $192,346,712,597 | $45.80 | — | +$1,007,921,417 | +$4,703,670,660 | — | +0.5% | +2.5% | 4,199,709,952 | $646,366,229 | 0.34% |  |
United States | Communication Services | |||
| ☆ | 94 |  |
Salesforce.com CRM | Company | $188,642,046,356 | $189.59 | — | -$1,462,651,215 | +$7,313,240,891 | — | -0.8% | +4.0% | 995,000,000 | $727,248,267 | 0.39% | 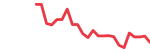 |
United States | Technology | |||
| ☆ | 95 |  |
Novartis NVS | Company | $187,396,562,319 | $85.82 | — | +$960,789,387 | -$2,904,192,169 | — | +0.5% | -1.5% | 2,183,600,128 | $141,929,115 | 0.08% | 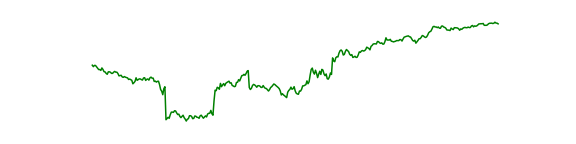 |
Switzerland | Health Care | |||
| ☆ | 96 |  |
NextEra Energy NEE | Company | $187,076,624,174 | $90.53 | — | -$971,238,738 | +$3,327,001,913 | — | -0.5% | +1.8% | 2,066,460,032 | $475,336,812 | 0.25% |  |
United States | Public Utilities | |||
| ☆ | 97 |  |
Nike NKE | Company | $184,860,709,155 | $118.06 | — | +$2,724,523,511 | +$12,448,264,476 | — | +1.5% | +7.2% | 1,565,820,032 | $730,767,773 | 0.40% | 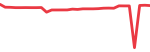 |
United States | Consumer Non-Durables | |||
| ☆ | 98 |  |
T-Mobile US TMUS | Company | $183,879,900,708 | $146.63 | — | -$75,239,342 | +$1,316,745,894 | — | -0.0% | +0.7% | 1,254,040,064 | $428,907,427 | 0.23% |  |
United States | Communication Services | |||
| ☆ | 100 |  |
PHILIP MRRS INT-WI PMI.SW | Company | $179,354,554,823 | $104.66 | — | — | +$26,801,766,292 | — | — | +17.6% | 1,713,760,000 | — | — |  |
United States | Consumer Defensive |