The global leaderboard of wealth: $1.2 Quadrillion of Assets ranked by Market Cap
| ☆ | +/- | Asset Name | Type | Market Cap ($) | Price ($) | Market Cap 1Hr Δ ($) |
Market Cap 24Hr Δ ($) |
Market Cap 7d Δ ($) |
1Hr Change | 24Hr Change | 7d Change | Circ. Supply Max. Supply |
24Hr Volume | 24Hr Vol / Mkt Cap (%) |
Last 30 Days | Country | Sector | ||||
|---|---|---|---|---|---|---|---|---|---|---|---|---|---|---|---|---|---|---|---|---|---|
| ☆ | 13 |  |
Apple AAPL | Company | $2,649,592,780,839 | $164.87 | — | -$7,714,160,743 | +$53,997,899,099 | — | -0.3% | +2.1% | 16,070,800,384 | $9,937,852,209 | 0.38% | 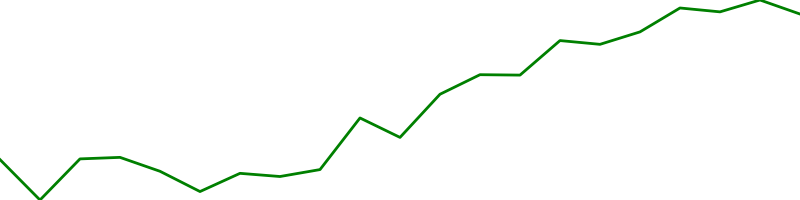 |
United States | Information Technology | |||
| ☆ | 16 |  |
Saudi Arabian Oil 2222.SR | Company | $2,091,313,286,968 | $9.51 | — | +$2,660,785,177 | -$40,705,136,584 | — | +0.1% | -1.9% | 219,871,002,624 | $31,029,452 | 0.00% | 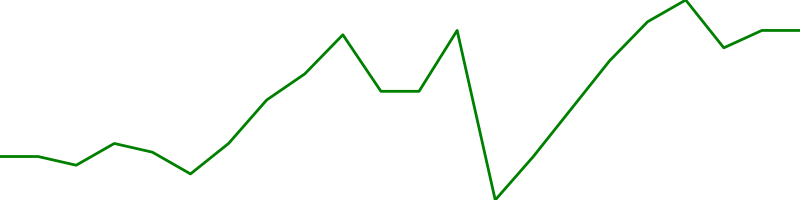 |
Saudi Arabia | Energy minerals | |||
| ☆ | 17 |  |
Microsoft MSFT | Company | $2,090,595,721,117 | $280.32 | — | -$19,315,907,250 | +$17,227,707,212 | — | -0.9% | +0.8% | 7,457,889,792 | $5,252,972,681 | 0.25% | 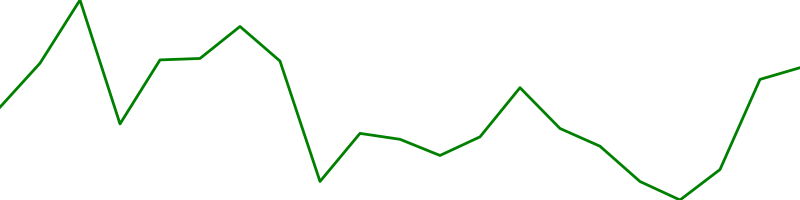 |
United States | Information Technology | |||
| ☆ | 21 |  |
Alphabet GOOG | Company | $1,535,063,835,582 | $118.14 | — | -$1,039,511,751 | +$34,562,923,089 | — | -0.1% | +2.3% | 12,993,599,488 | $2,015,598,344 | 0.13% |  |
United States | Communication Services | |||
| ☆ | 22 |  |
Amazon AMZN | Company | $1,420,253,335,464 | $139.41 | — | -$14,160,757,604 | +$40,954,195,012 | — | -1.0% | +3.0% | 10,187,599,872 | $7,281,245,081 | 0.51% | 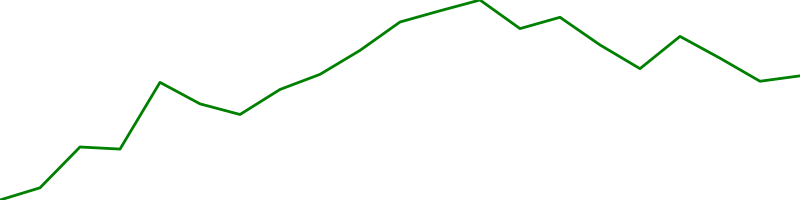 |
United States | Consumer Discretionary | |||
| ☆ | 32 |  |
Berkshire Hathaway BRK-B | Company | $650,126,133,624 | $292.34 | — | +$600,420,455 | -$7,827,997,799 | — | +0.1% | -1.2% | 2,223,869,952 | $1,159,303,489 | 0.18% |  |
United States | Financials | |||
| ☆ | 37 |  |
UnitedHealth UNH | Company | $501,926,482,085 | $536.60 | — | +$1,440,469,230 | +$1,141,139,827 | — | +0.3% | +0.2% | 935,382,976 | $888,824,200 | 0.18% | 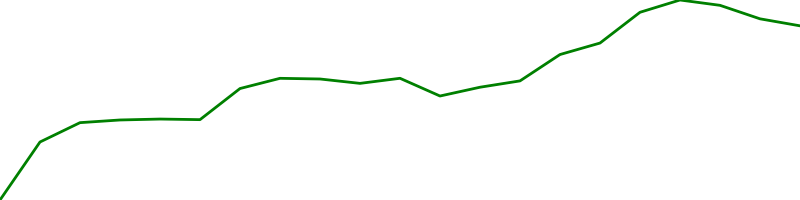 |
United States | Health Care | |||
| ☆ | 41 |  |
Taiwan Semiconductor Manufacturing TSM | Company | $456,056,841,405 | $87.94 | — | -$9,490,349,696 | +$8,453,205,114 | — | -2.0% | +1.9% | 5,185,999,872 | $1,065,859,212 | 0.23% | 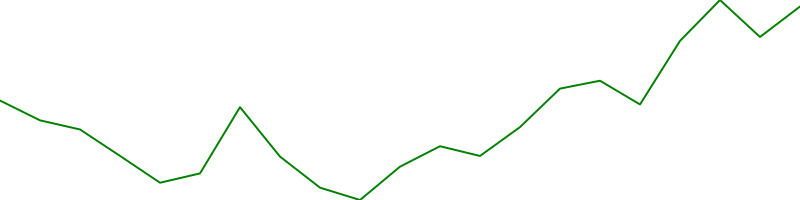 |
Taiwan | Technology | |||
| ☆ | 42 |  |
Meta Platforms META | Company | $452,807,120,448 | $170.25 | — | +$8,351,330,877 | +$27,447,711,010 | — | +1.9% | +6.5% | 2,659,660,032 | $4,647,671,775 | 1.03% | 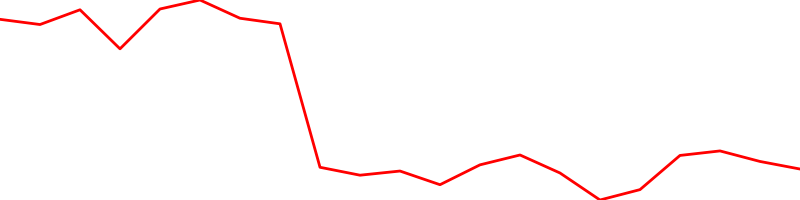 |
United States | Communication Services | |||
| ☆ | 44 |  |
Visa V | Company | $450,288,677,487 | $213.32 | — | -$5,382,667,314 | +$4,137,299,835 | — | -1.2% | +0.9% | 2,110,860,032 | $866,804,518 | 0.19% | 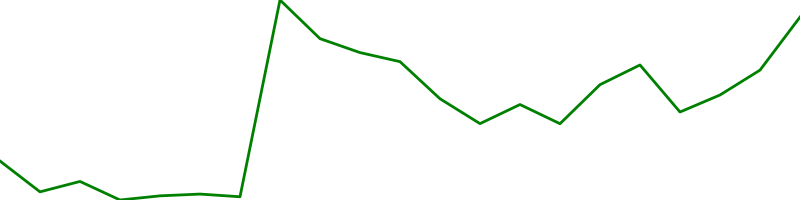 |
United States | Miscellaneous | |||
| ☆ | 45 |  |
Johnson & Johnson JNJ | Company | $447,486,411,637 | $170.20 | — | -$2,392,563,341 | -$9,754,275,096 | — | -0.5% | -2.1% | 2,629,179,904 | $787,991,946 | 0.18% | 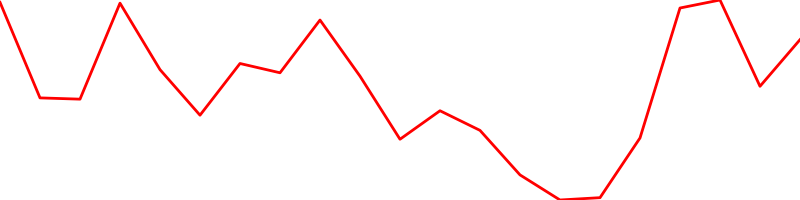 |
United States | Health Care | |||
| ☆ | 46 |  |
Exxon Mobil XOM | Company | $387,029,457,877 | $88.95 | — | +$2,175,545,088 | -$24,061,556,558 | — | +0.6% | -5.9% | 4,351,090,176 | $1,286,083,531 | 0.33% | 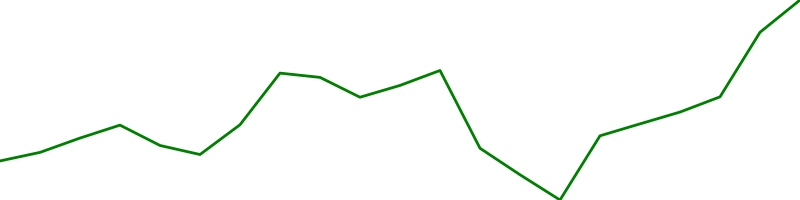 |
United States | Energy | |||
| ☆ | 47 |  |
Tencent TCEHY | Company | $363,664,138,270 | $37.81 | — | -$6,636,544,482 | +$4,712,933,924 | — | -1.8% | +1.3% | 9,618,199,552 | $112,545,250 | 0.03% | 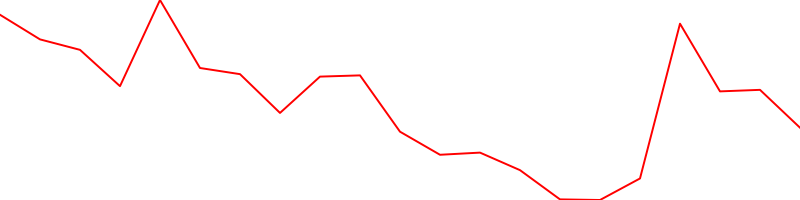 |
China | Communication Services | |||
| ☆ | 48 |  |
Kweichow Moutai 600519.SS | Company | $355,169,259,125 | $282.73 | — | -$2,309,526,685 | +$3,022,672,040 | — | -0.6% | +0.9% | 1,256,199,936 | $474,963,560 | 0.13% |  |
China | Consumer Defensive | |||
| ☆ | 49 |  |
LVMH-Moet Hennessy Louis Vuitto LVMUY | Company | $351,920,383,727 | $140.43 | — | +$2,054,916,595 | -$852,075,894 | — | +0.6% | -0.2% | 2,506,020,096 | $16,528,610 | 0.00% |  |
France | Consumer Cyclical | |||
| ☆ | 50 |  |
Procter & Gamble PG | Company | $349,099,783,697 | $145.27 | — | +$1,321,717,772 | +$5,695,395,369 | — | +0.4% | +1.7% | 2,403,109,888 | $651,797,455 | 0.19% | 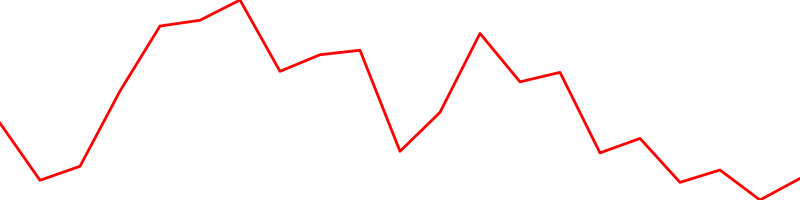 |
United States | Consumer Non-Durables | |||
| ☆ | 51 |  |
JP Morgan Chase JPM | Company | $339,587,484,787 | $114.35 | — | -$4,187,316,166 | +$415,758,996 | — | -1.2% | +0.1% | 2,969,720,064 | $1,181,521,359 | 0.35% | 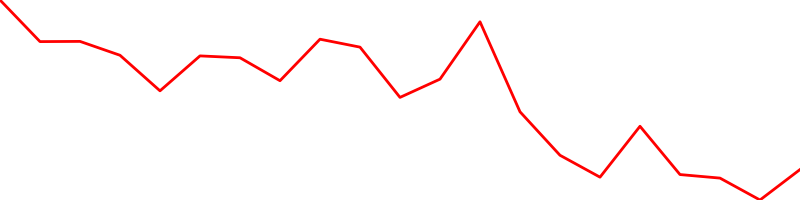 |
United States | Finance | |||
| ☆ | 52 |  |
Mastercard MA | Company | $338,464,844,828 | $352.16 | — | -$5,141,949,588 | +$1,556,995,088 | — | -1.5% | +0.5% | 961,110,976 | $872,511,625 | 0.26% | 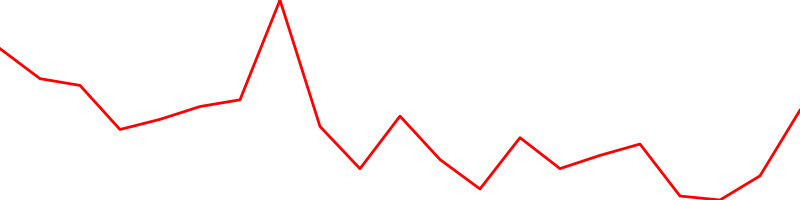 |
United States | Miscellaneous | |||
| ☆ | 53 |  |
Nestle S.A NSRGF | Company | $330,385,013,699 | $120.14 | — | +$522,506,738 | -$11,907,505,590 | — | +0.2% | -3.5% | 2,750,000,128 | $408,476 | 0.00% |  |
Switzerland | Consumer Defensive | |||
| ☆ | 55 |  |
Home Depot HD | Company | $321,400,859,349 | $311.97 | — | +$2,348,923,179 | +$6,335,908,310 | — | +0.7% | +2.0% | 1,030,230,016 | $781,516,050 | 0.24% | 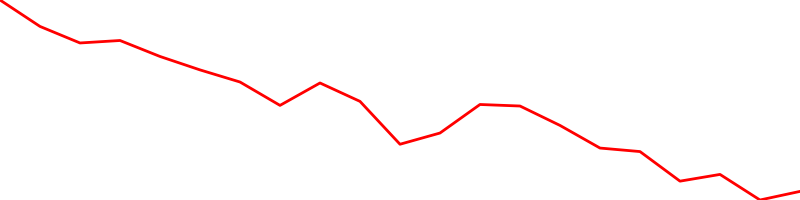 |
United States | Consumer Services | |||
| ☆ | 56 |  |
SAMSUNG ELECTRONICS SMSNN.MX | Company | $319,562,747,159 | $1,156.80 | — | — | -$735,576,138 | — | — | -0.2% | 276,247,008 | — | — |  |
South Korea | Technology | |||
| ☆ | 57 |  |
Chevron CVX | Company | $309,837,584,551 | $153.41 | — | -$464,515,475 | -$14,339,638,623 | — | -0.1% | -4.4% | 2,019,670,016 | $915,382,151 | 0.30% | 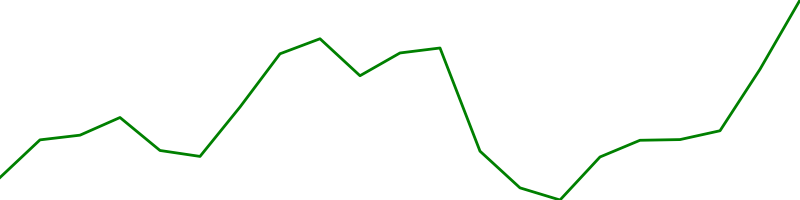 |
United States | Energy | |||
| ☆ | 58 |  |
Tesla TSLA | Company | $303,344,269,587 | $290.42 | — | +$2,353,576,872 | -$7,158,237,174 | — | +0.8% | -2.3% | 1,044,489,984 | $28,750,168,104 | 9.48% | 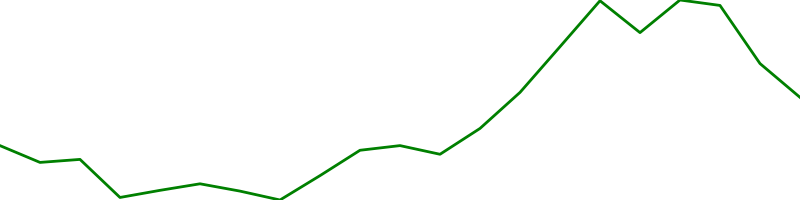 |
United States | Consumer Discretionary | |||
| ☆ | 60 |  |
Eli Lilly and LLY | Company | $293,257,419,840 | $302.50 | — | +$1,143,939,198 | -$20,988,500,329 | — | +0.4% | -6.7% | 969,446,016 | $973,717,250 | 0.33% | 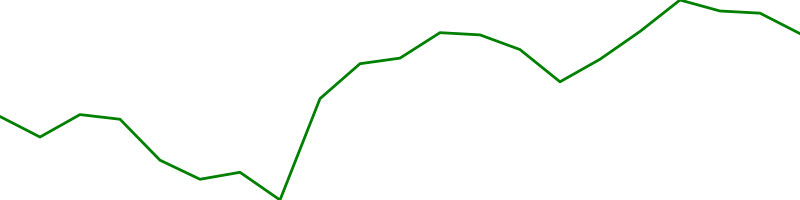 |
United States | Health Care | |||
| ☆ | 62 |  |
Roche RHHVF | Company | $278,275,810,560 | $330.00 | — | +$3,541,702,428 | +$4,637,930,176 | — | +1.3% | +1.7% | 843,260,032 | $33,000 | 0.00% | 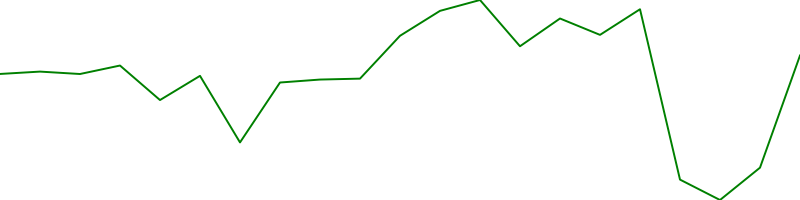 |
Switzerland | Healthcare | |||
| ☆ | 63 |  |
Pfizer PFE | Company | $278,132,309,701 | $49.57 | — | +$1,683,265,710 | -$5,835,341,104 | — | +0.6% | -2.1% | 5,610,899,968 | $796,679,121 | 0.29% |  |
United States | Health Care | |||
| ☆ | 64 |  |
Coca-Cola KO | Company | $272,408,233,341 | $62.97 | — | -$1,773,659,392 | -$6,705,280,396 | — | -0.6% | -2.4% | 4,326,000,128 | $577,132,655 | 0.21% | 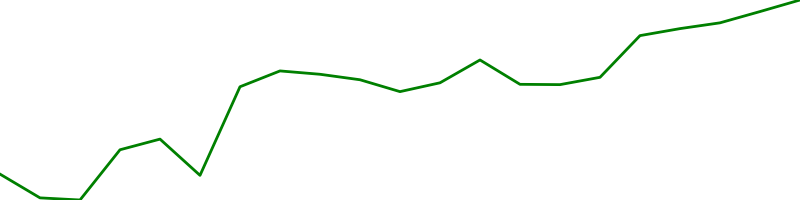 |
United States | Consumer Non-Durables | |||
| ☆ | 65 |  |
Bank of America BAC | Company | $271,033,921,286 | $33.49 | — | -$3,803,679,712 | -$1,780,434,656 | — | -1.4% | -0.7% | 8,092,980,224 | $1,120,384,563 | 0.41% | 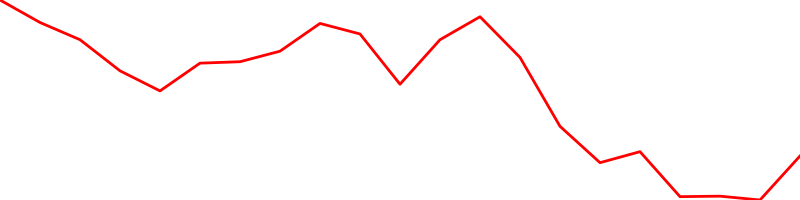 |
United States | Finance | |||
| ☆ | 70 |  |
AbbVie ABBV | Company | $248,135,143,034 | $140.34 | — | +$4,066,635,322 | +$212,163,363 | — | +1.7% | +0.1% | 1,768,099,968 | $681,294,546 | 0.27% | 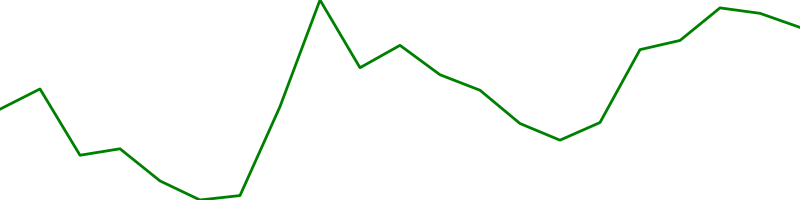 |
United States | Health Care | |||
| ☆ | 71 |  |
PepsiCo PEP | Company | $241,237,739,906 | $173.85 | — | -$971,329,743 | -$4,301,609,197 | — | -0.4% | -1.8% | 1,387,619,968 | $494,794,502 | 0.21% |  |
United States | Consumer Staples | |||
| ☆ | 72 |  |
Alibaba BABA | Company | $240,557,030,809 | $90.84 | — | -$4,554,804,088 | +$1,324,070,016 | — | -1.9% | +0.6% | 2,648,140,032 | $1,471,071,985 | 0.61% |  |
China | Consumer Services | |||
| ☆ | 74 |  |
Costco COST | Company | $240,041,664,850 | $541.90 | — | +$544,862,885 | -$2,174,936,473 | — | +0.2% | -0.9% | 442,963,008 | $728,367,823 | 0.30% |  |
United States | Consumer Staples | |||
| ☆ | 75 |  |
ASML Holding N.V. - New York Re ASML | Company | $231,932,812,336 | $572.75 | — | -$1,846,552,698 | -$2,186,718,200 | — | -0.8% | -0.9% | 404,945,984 | $401,268,650 | 0.17% | 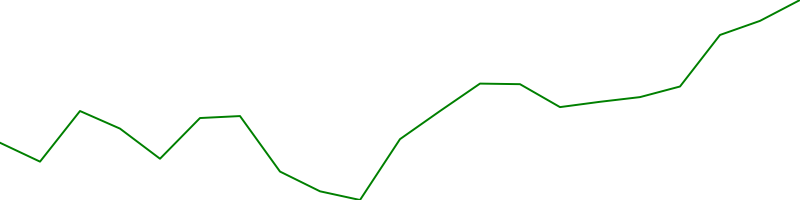 |
Netherlands | Technology | |||
| ☆ | 76 |  |
ASML Holding N.V ASMLF | Company | $229,119,434,933 | $560.36 | — | -$1,758,174,743 | -$2,371,493,255 | — | -0.8% | -1.0% | 408,879,008 | $560,360 | 0.00% | 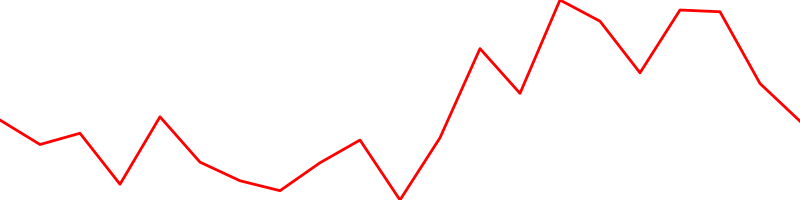 |
Netherlands | Technology | |||
| ☆ | 77 |  |
Thermo Fisher Scientific TMO | Company | $228,594,249,022 | $583.95 | — | -$2,470,124,365 | -$2,192,177,732 | — | -1.1% | -0.9% | 391,462,016 | $538,051,541 | 0.24% |  |
United States | Capital Goods | |||
| ☆ | 78 |  |
Toyota Motor TM | Company | $221,104,219,680 | $156.20 | — | -$1,571,228,064 | -$14,962,056,768 | — | -0.7% | -6.3% | 1,415,520,000 | $40,596,379 | 0.02% | 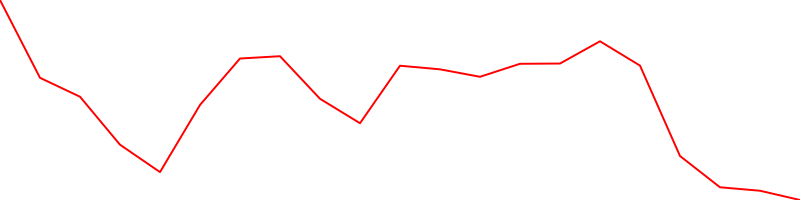 |
Japan | Capital Goods | |||
| ☆ | 80 |  |
Oracle ORCL | Company | $206,929,360,044 | $76.47 | — | -$2,381,290,252 | -$2,624,842,796 | — | -1.1% | -1.3% | 2,706,020,096 | $361,970,751 | 0.17% | 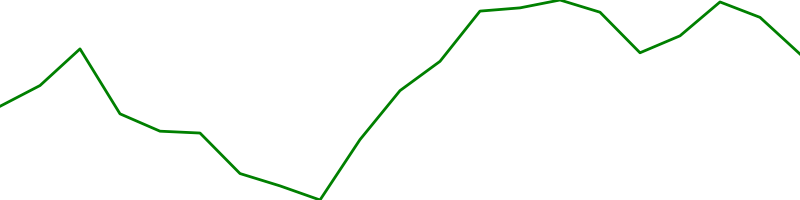 |
United States | Technology | |||
| ☆ | 81 |  |
Adobe ADBE | Company | $205,225,648,270 | $434.34 | — | +$429,976,730 | +$10,985,625,000 | — | +0.2% | +5.7% | 472,500,000 | $956,416,672 | 0.47% |  |
United States | Information Technology | |||
| ☆ | 82 |  |
AstraZeneca AZN.ST | Company | $201,925,966,546 | $130.23 | — | -$2,734,888,937 | -$3,222,441,835 | — | -1.3% | -1.6% | 1,550,530,048 | $44,743,479 | 0.02% |  |
United Kingdom | Healthcare | |||
| ☆ | 83 |  |
Walt Disney DIS | Company | $198,741,676,929 | $109.11 | — | +$4,517,276,356 | +$5,264,075,903 | — | +2.3% | +2.7% | 1,821,479,936 | $1,421,255,957 | 0.72% |  |
United States | Consumer Services | |||
| ☆ | 85 |  |
L'Oreal LRLCY | Company | $197,059,690,719 | $73.43 | — | +$966,112,061 | -$6,548,088,308 | — | +0.5% | -3.2% | 2,683,640,064 | $4,464,544 | 0.00% |  |
France | Consumer Defensive | |||
| ☆ | 86 |  |
Accenture plc Class A Ordinary Shares (Ireland) ACN | Company | $196,298,602,416 | $310.33 | — | +$619,884,654 | +$3,535,940,825 | — | +0.3% | +1.8% | 632,547,968 | $497,986,529 | 0.25% |  |
Ireland | Technology | |||
| ☆ | 87 |  |
SHELL RYDAF | Company | $196,210,869,120 | $26.25 | — | +$1,868,674,944 | +$3,214,123,185 | — | +1.0% | +1.7% | 7,474,699,776 | $86,625 | 0.00% |  |
United Kingdom | Energy | |||
| ☆ | 88 |  |
BHP BHP | Company | $194,350,316,347 | $54.38 | — | -$71,480,236 | +$679,055,422 | — | -0.0% | +0.4% | 3,573,929,984 | $126,743,468 | 0.07% |  |
Australia | Basic Industries | |||
| ☆ | 89 |  |
Danaher DHR | Company | $191,000,738,445 | $254.42 | — | -$2,003,249,875 | -$605,640,609 | — | -1.0% | -0.3% | 750,718,976 | $402,101,729 | 0.21% |  |
United States | Health Care | |||
| ☆ | 90 |  |
Abbott Laboratories ABT | Company | $190,882,976,512 | $109.00 | — | -$437,804,992 | -$910,628,505 | — | -0.2% | -0.5% | 1,751,219,968 | $248,934,200 | 0.13% |  |
United States | Health Care | |||
| ☆ | 92 |  |
McDonald's MCD | Company | $188,932,114,565 | $256.80 | — | -$1,787,809,354 | -$5,466,394,314 | — | -0.9% | -2.8% | 735,716,992 | $578,698,772 | 0.31% |  |
United States | Consumer Services | |||
| ☆ | 93 |  |
Salesforce.com CRM | Company | $188,801,250,000 | $189.75 | — | -$417,898,178 | +$6,736,154,251 | — | -0.2% | +3.7% | 995,000,000 | $644,542,800 | 0.34% |  |
United States | Technology | |||
| ☆ | 94 |  |
Novartis NVS | Company | $188,010,082,566 | $85.94 | — | +$809,451,303 | +$678,195,245 | — | +0.4% | +0.4% | 2,187,689,984 | $120,805,861 | 0.06% | 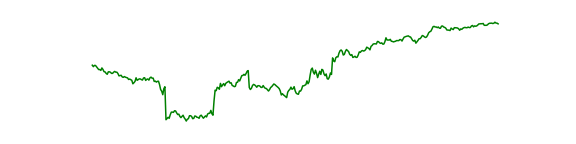 |
Switzerland | Health Care | |||
| ☆ | 95 |  |
Cisco CSCO | Company | $187,782,020,628 | $45.02 | — | +$41,719,710 | -$1,084,473,782 | — | +0.0% | -0.6% | 4,171,079,936 | $696,261,319 | 0.37% | 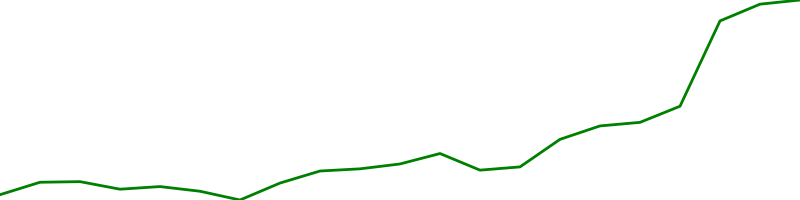 |
United States | Information Technology | |||
| ☆ | 96 |  |
Verizon VZ | Company | $187,055,085,107 | $44.54 | — | -$1,721,880,439 | -$7,223,490,223 | — | -0.9% | -3.7% | 4,199,709,952 | $917,390,399 | 0.49% |  |
United States | Communication Services | |||
| ☆ | 98 |  |
T-Mobile US TMUS | Company | $181,309,114,749 | $144.58 | — | +$25,086,159 | +$990,702,366 | — | +0.0% | +0.5% | 1,254,040,064 | $484,429,754 | 0.27% |  |
United States | Communication Services | |||
| ☆ | 99 |  |
NextEra Energy NEE | Company | $180,856,575,064 | $87.52 | — | -$950,585,489 | +$4,566,874,779 | — | -0.5% | +2.6% | 2,066,460,032 | $633,924,840 | 0.35% |  |
United States | Public Utilities | |||
| ☆ | 100 |  |
Nike NKE | Company | $178,503,483,648 | $114.00 | — | +$203,552,304 | -$469,750,788 | — | +0.1% | -0.3% | 1,565,820,032 | $692,162,400 | 0.39% |  |
United States | Consumer Non-Durables |