The global leaderboard of wealth: $1.2 Quadrillion of Assets ranked by Market Cap
| ☆ | +/- | Asset Name | Type | Market Cap ($) | Price ($) | Market Cap 1Hr Δ ($) |
Market Cap 24Hr Δ ($) |
Market Cap 7d Δ ($) |
1Hr Change | 24Hr Change | 7d Change | Circ. Supply Max. Supply |
24Hr Volume | 24Hr Vol / Mkt Cap (%) |
Last 30 Days | Country | Sector | ||||
|---|---|---|---|---|---|---|---|---|---|---|---|---|---|---|---|---|---|---|---|---|---|
| ☆ | 12 |  |
Apple AAPL | Company | $2,651,033,350,342 | $161.02 | — | +$7,738,100,098 | +$181,433,350,342 | — | +0.3% | +7.3% | 16,464,000,000 | $18,914,681,760 | 0.71% | 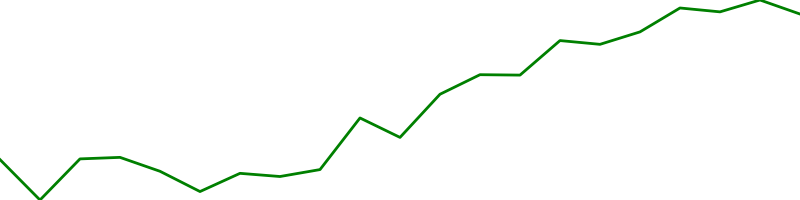 |
United States | Information Technology | |||
| ☆ | 14 |  |
Microsoft MSFT | Company | $2,551,436,666,463 | $339.83 | — | -$24,626,164,500 | +$28,229,848,153 | — | -1.0% | +1.1% | 7,507,979,776 | $10,545,298,296 | 0.41% | 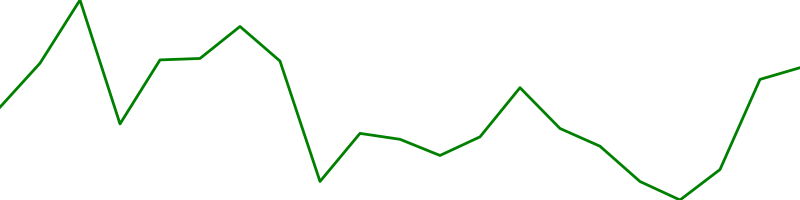 |
United States | Information Technology | |||
| ☆ | 19 |  |
Saudi Arabian Oil 2222.SR | Company | $1,561,328,908,275 | $7.81 | — | -$28,628,002,612 | -$79,583,933,724 | — | -1.8% | -4.8% | 199,882,997,760 | $54,452,341 | 0.00% | 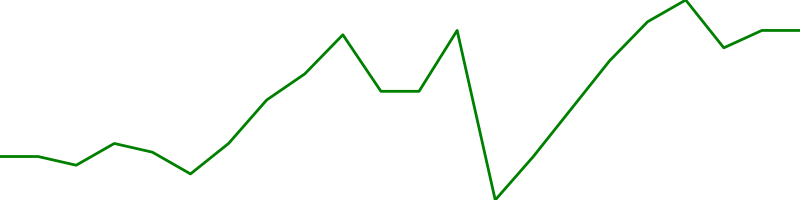 |
Saudi Arabia | Energy minerals | |||
| ☆ | 25 |  |
Meta Platforms META | Company | $922,882,165,980 | $341.01 | — | -$11,610,052,786 | -$17,726,362,125 | — | -1.2% | -1.9% | 2,706,319,872 | $9,247,100,233 | 1.00% | 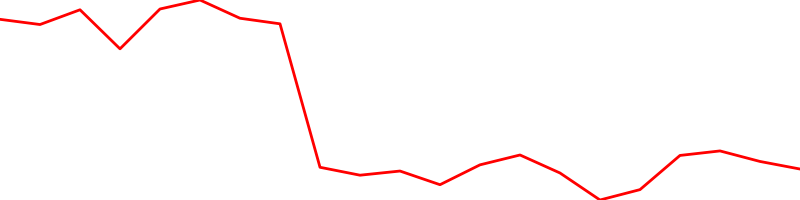 |
United States | Communication Services | |||
| ☆ | 29 |  |
Taiwan Semiconductor Manufacturing TSM | Company | $646,963,448,064 | $124.75 | — | +$2,541,167,996 | +$34,383,694,459 | — | +0.4% | +5.6% | 5,186,079,744 | $2,005,493,475 | 0.31% | 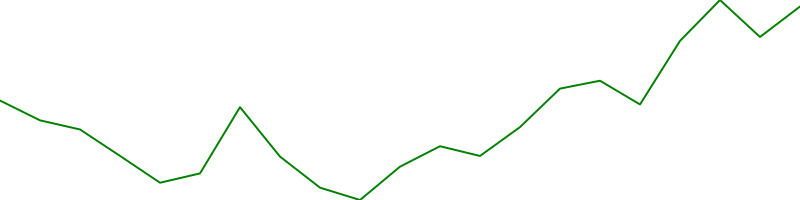 |
Taiwan | Technology | |||
| ☆ | 30 |  |
Berkshire Hathaway BRK-B | Company | $638,107,671,874 | $284.97 | — | +$11,151,290,321 | +$671,735,661 | — | +1.8% | +0.1% | 2,239,209,984 | $1,435,108,926 | 0.22% |  |
United States | Financials | |||
| ☆ | 34 |  |
Tencent TCTZF | Company | $598,423,864,578 | $61.97 | — | -$11,877,699,935 | -$7,725,328,799 | — | -1.9% | -1.3% | 9,656,670,208 | $743,640 | 0.00% |  |
China | Communication Services | |||
| ☆ | 39 |  |
JP Morgan Chase JPM | Company | $489,927,357,676 | $164.35 | — | +$10,224,853,433 | -$6,587,984,386 | — | +2.1% | -1.3% | 2,980,999,936 | $2,391,276,154 | 0.49% | 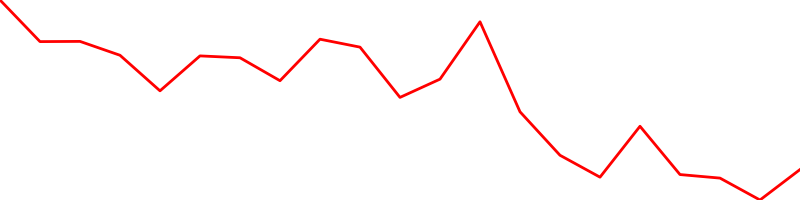 |
United States | Finance | |||
| ☆ | 43 |  |
Home Depot HD | Company | $433,223,380,815 | $408.79 | — | +$105,983,467 | +$39,963,949,383 | — | +0.0% | +10.2% | 1,059,769,984 | $1,637,776,290 | 0.38% | 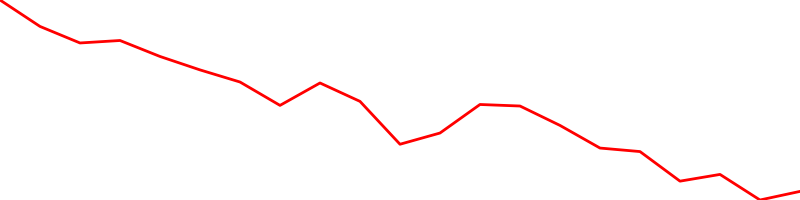 |
United States | Consumer Services | |||
| ☆ | 45 |  |
Johnson & Johnson JNJ | Company | $424,257,427,669 | $159.70 | — | -$8,474,528,841 | -$10,148,193,563 | — | -2.0% | -2.3% | 2,656,590,080 | $1,219,229,627 | 0.29% | 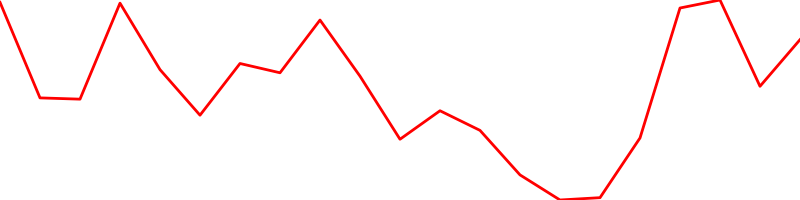 |
United States | Health Care | |||
| ☆ | 46 |  |
Visa V | Company | $422,636,655,415 | $195.58 | — | -$11,409,760,731 | -$36,130,919,973 | — | -2.6% | -7.9% | 2,160,940,032 | $4,143,518,803 | 0.98% | 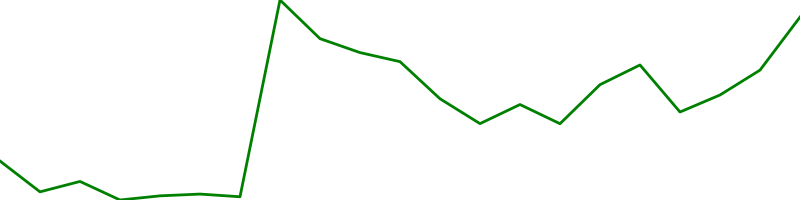 |
United States | Miscellaneous | |||
| ☆ | 47 |  |
LVMH-Moet Hennessy Louis Vuitto LVMHF | Company | $414,553,444,312 | $823.18 | — | -$1,420,155,688 | +$1,601,444,312 | — | -0.3% | +0.4% | 503,600,000 | $1,481,724 | 0.00% |  |
France | Consumer Cyclical | |||
| ☆ | 48 |  |
Alibaba BABA | Company | $413,224,938,017 | $136.62 | — | -$11,251,627,352 | -$90,496,924,540 | — | -2.7% | -18.0% | 3,024,630,016 | $3,605,456,319 | 0.87% |  |
China | Consumer Services | |||
| ☆ | 49 |  |
UnitedHealth UNH | Company | $413,078,903,828 | $437.54 | — | -$2,322,463,212 | -$12,518,667,060 | — | -0.6% | -2.9% | 944,094,016 | $1,137,035,220 | 0.28% | 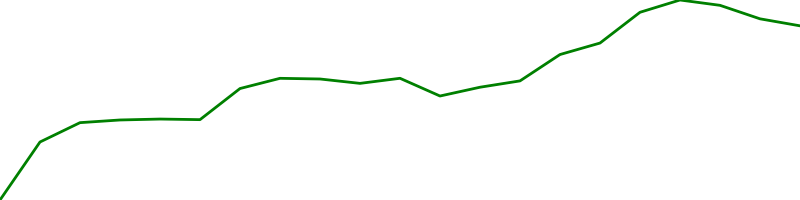 |
United States | Health Care | |||
| ☆ | 50 |  |
Tesla TSLA | Company | $387,266,064,543 | $385.62 | — | +$6,631,462,505 | +$48,030,400,198 | — | +1.7% | +14.2% | 1,004,259,968 | $38,260,581,904 | 9.88% | 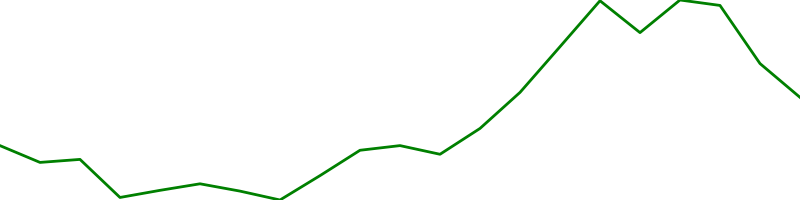 |
United States | Consumer Discretionary | |||
| ☆ | 51 |  |
Bank of America BAC | Company | $387,082,201,466 | $46.28 | — | +$7,360,226,515 | -$6,440,222,130 | — | +1.9% | -1.6% | 8,363,919,872 | $2,485,101,722 | 0.64% | 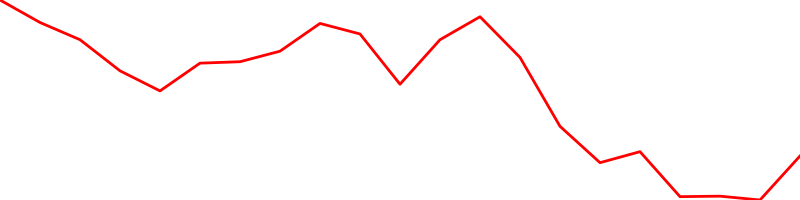 |
United States | Finance | |||
| ☆ | 52 |  |
Kweichow Moutai 600519.SS | Company | $364,744,907,625 | $290.36 | — | +$5,086,798,508 | +$17,906,433,438 | — | +1.4% | +5.2% | 1,256,199,936 | $1,236,122,355 | 0.34% |  |
China | Consumer Defensive | |||
| ☆ | 53 |  |
Nestle S.A NSRGF | Company | $362,442,931,200 | $131.25 | — | -$1,905,421,009 | -$11,819,088,024 | — | -0.5% | -3.2% | 2,761,469,952 | $511,875 | 0.00% |  |
Switzerland | Consumer Defensive | |||
| ☆ | 54 |  |
Procter & Gamble PG | Company | $358,178,517,936 | $147.80 | — | +$2,374,921,583 | +$969,382,161 | — | +0.7% | +0.3% | 2,423,399,936 | $979,234,140 | 0.27% | 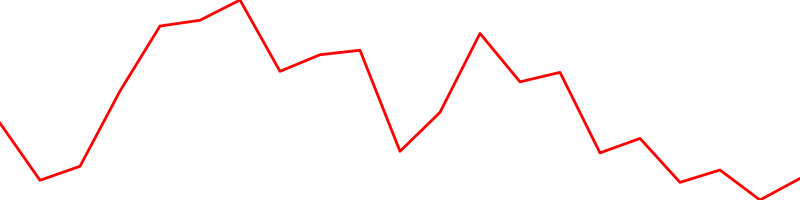 |
United States | Consumer Non-Durables | |||
| ☆ | 55 |  |
AstraZeneca AZN | Company | $350,416,585,224 | $113.10 | — | -$681,627,564 | -$20,014,950,047 | — | -0.2% | -5.4% | 3,098,289,920 | $286,906,421 | 0.08% |  |
United Kingdom | Healthcare | |||
| ☆ | 56 |  |
ASML Holding N.V ASMLF | Company | $346,232,604,672 | $834.00 | — | -$8,336,159,015 | -$9,423,842,149 | — | -2.4% | -2.6% | 415,147,008 | $14,928,600 | 0.00% | 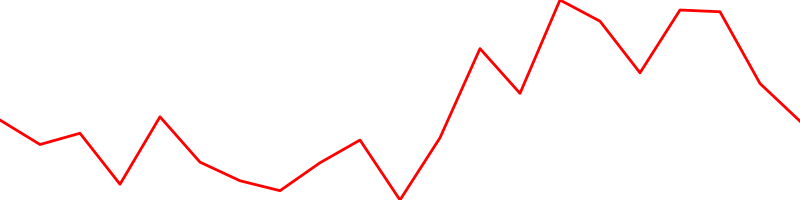 |
Netherlands | Technology | |||
| ☆ | 57 |  |
Roche RHHBY | Company | $337,540,144,630 | $48.94 | — | -$5,586,595,594 | -$5,310,708,483 | — | -1.6% | -1.5% | 6,897,019,904 | $16,536,826 | 0.00% |  |
Switzerland | Healthcare | |||
| ☆ | 58 |  |
Adobe ADBE | Company | $320,484,609,485 | $673.57 | — | -$7,041,834,192 | +$6,585,084,778 | — | -2.2% | +2.1% | 475,800,000 | $1,538,905,396 | 0.48% | 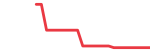 |
United States | Information Technology | |||
| ☆ | 59 |  |
Mastercard MA | Company | $315,695,549,535 | $321.30 | — | -$18,098,712,986 | -$39,361,230,701 | — | -5.4% | -11.1% | 982,556,992 | $3,655,815,521 | 1.16% | 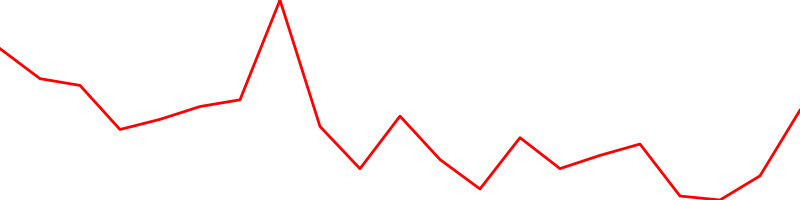 |
United States | Miscellaneous | |||
| ☆ | 61 |  |
Salesforce.com CRM | Company | $290,606,356,415 | $296.84 | — | -$4,239,086,731 | -$8,468,344,025 | — | -1.4% | -2.8% | 979,000,000 | $1,328,269,932 | 0.46% |  |
United States | Technology | |||
| ☆ | 62 |  |
Pfizer PFE | Company | $287,378,955,655 | $51.20 | — | +$2,245,156,622 | +$8,699,944,441 | — | +0.8% | +3.1% | 5,612,870,144 | $1,397,140,501 | 0.49% |  |
United States | Health Care | |||
| ☆ | 65 |  |
Walt Disney DIS | Company | $280,128,764,988 | $154.16 | — | +$290,747,452 | -$7,759,125,068 | — | +0.1% | -2.7% | 1,817,129,984 | $1,971,768,111 | 0.70% | 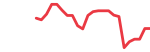 |
United States | Consumer Services | |||
| ☆ | 67 |  |
Nike NKE | Company | $271,167,986,512 | $174.24 | — | -$996,024,681 | +$8,388,402,409 | — | -0.4% | +3.2% | 1,556,290,048 | $1,029,131,168 | 0.38% | 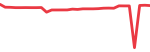 |
United States | Consumer Non-Durables | |||
| ☆ | 68 |  |
Exxon Mobil XOM | Company | $269,210,205,380 | $61.51 | — | +$3,676,420,416 | -$12,517,353,270 | — | +1.4% | -4.4% | 4,376,690,176 | $1,352,875,507 | 0.50% | 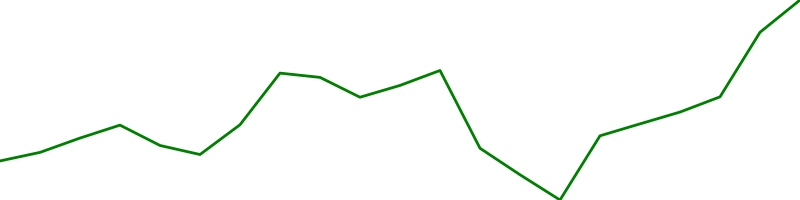 |
United States | Energy | |||
| ☆ | 69 |  |
L'Oreal LRLCF | Company | $263,897,130,329 | $471.26 | — | -$6,288,587,103 | -$5,583,021,383 | — | -2.3% | -2.1% | 559,982,016 | $518,386 | 0.00% |  |
France | Consumer Defensive | |||
| ☆ | 70 |  |
Oracle ORCL | Company | $260,040,306,581 | $94.61 | — | +$1,759,070,251 | +$1,621,655,338 | — | +0.7% | +0.6% | 2,748,549,888 | $613,848,606 | 0.24% | 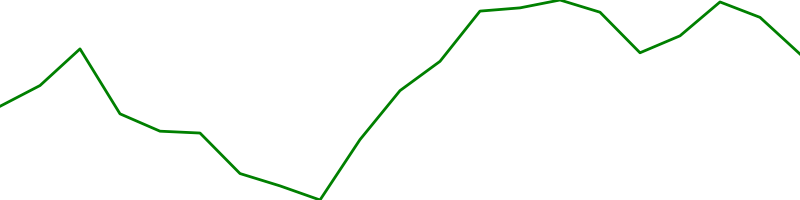 |
United States | Technology | |||
| ☆ | 71 |  |
Toyota Motor TOYOF | Company | $258,906,424,715 | $18.60 | — | -$4,175,899,371 | +$1,252,775,121 | — | -1.6% | +0.5% | 13,919,699,968 | $386,880 | 0.00% | 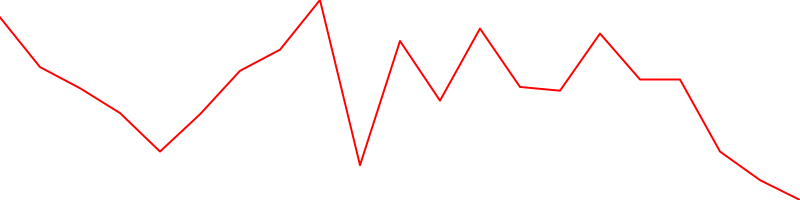 |
Japan | Consumer Cyclical | |||
| ☆ | 73 |  |
Thermo Fisher Scientific TMO | Company | $249,810,678,738 | $633.96 | — | -$823,546,852 | +$630,491,230 | — | -0.3% | +0.3% | 394,048,000 | $836,129,873 | 0.33% |  |
United States | Capital Goods | |||
| ☆ | 74 |  |
Eli Lilly and LLY | Company | $249,134,822,815 | $260.44 | — | -$248,723,262 | +$1,922,759,262 | — | -0.1% | +0.8% | 956,592,000 | $519,681,981 | 0.21% | 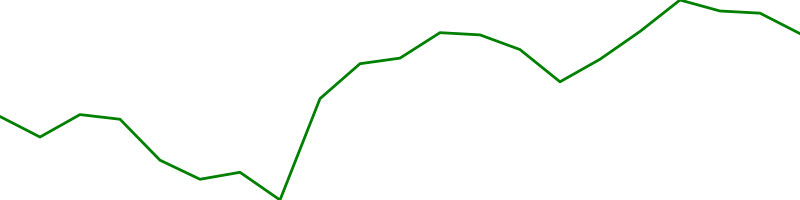 |
United States | Health Care | |||
| ☆ | 76 |  |
Coca-Cola KO | Company | $239,598,227,348 | $55.47 | — | +$1,468,603,426 | -$4,967,323,003 | — | +0.6% | -2.0% | 4,319,419,904 | $937,753,653 | 0.39% | 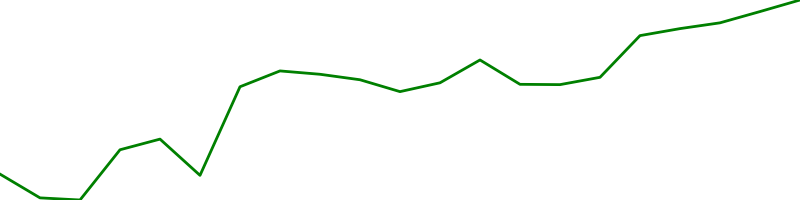 |
United States | Consumer Non-Durables | |||
| ☆ | 77 |  |
Costco COST | Company | $238,430,332,387 | $539.65 | — | +$2,589,109,135 | +$8,730,446,555 | — | +1.1% | +3.8% | 441,824,000 | $1,182,103,378 | 0.50% | 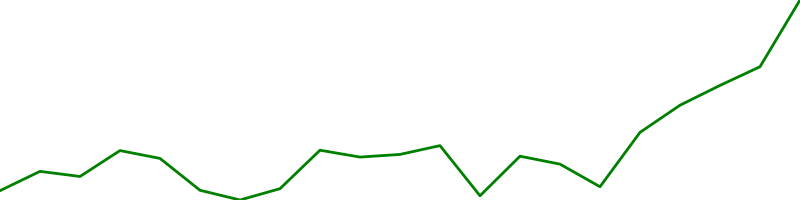 |
United States | Consumer Staples | |||
| ☆ | 79 |  |
Cisco CSCO | Company | $232,419,092,999 | $54.60 | — | +$5,746,619,591 | -$11,365,557,815 | — | +2.5% | -4.7% | 4,256,760,064 | $2,181,231,719 | 0.94% |  |
United States | Information Technology | |||
| ☆ | 80 |  |
Accenture plc Class A Ordinary Shares (Ireland) ACN | Company | $229,475,176,309 | $363.30 | — | -$4,099,363,354 | -$3,252,966,695 | — | -1.8% | -1.4% | 631,641,024 | $762,348,694 | 0.33% |  |
Ireland | Technology | |||
| ☆ | 82 |  |
PepsiCo PEP | Company | $227,996,136,649 | $164.15 | — | +$472,237,919 | +$486,119,789 | — | +0.2% | +0.2% | 1,388,950,016 | $682,404,355 | 0.30% |  |
United States | Consumer Staples | |||
| ☆ | 83 |  |
PayPal PYPL | Company | $222,625,740,475 | $189.48 | — | -$4,852,466,835 | -$27,093,884,038 | — | -2.1% | -10.8% | 1,174,930,048 | $5,676,176,440 | 2.55% |  |
United States | Financials | |||
| ☆ | 84 |  |
Abbott Laboratories ABT | Company | $221,496,015,190 | $125.26 | — | -$2,793,888,023 | -$7,391,452,940 | — | -1.2% | -3.2% | 1,768,290,048 | $526,768,413 | 0.24% |  |
United States | Health Care | |||
| ☆ | 85 |  |
Comcast CMCSA | Company | $221,487,692,776 | $48.28 | — | -$1,719,953,700 | -$8,040,796,238 | — | -0.8% | -3.5% | 4,587,990,016 | $926,901,846 | 0.42% |  |
United States | Communication Services | |||
| ☆ | 86 |  |
Chevron CVX | Company | $219,583,173,137 | $113.91 | — | +$3,855,379,968 | -$5,609,570,206 | — | +1.8% | -2.5% | 1,927,689,984 | $1,133,074,197 | 0.52% | 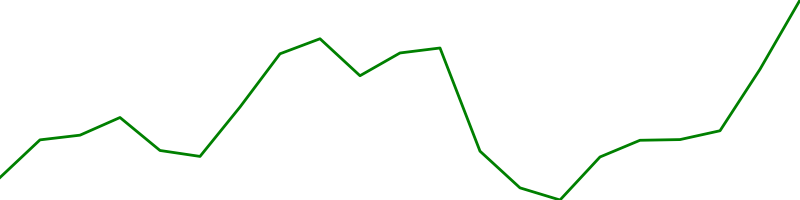 |
United States | Energy | |||
| ☆ | 87 |  |
Verizon VZ | Company | $217,869,891,870 | $51.54 | — | +$2,874,497,290 | -$3,635,394,580 | — | +1.3% | -1.6% | 4,227,200,000 | $1,172,617,485 | 0.54% |  |
United States | Communication Services | |||
| ☆ | 88 |  |
Meituan 3690.HK | Company | $215,546,932,812 | $35.17 | — | -$5,349,330,336 | -$12,248,322,166 | — | -2.4% | -5.4% | 6,128,880,128 | $693,005,067 | 0.32% |  |
China | Consumer Cyclical | |||
| ☆ | 89 |  |
Merck & Company Inc. Common Stock (new) MRK | Company | $206,217,737,446 | $81.64 | — | +$2,374,389,737 | -$5,178,184,643 | — | +1.2% | -2.4% | 2,525,939,968 | $888,259,521 | 0.43% |  |
United States | Health Care | |||
| ☆ | 90 |  |
AbbVie ABBV | Company | $205,345,833,410 | $115.65 | — | -$1,047,585,717 | -$2,112,931,026 | — | -0.5% | -1.0% | 1,775,580,032 | $459,801,276 | 0.22% | 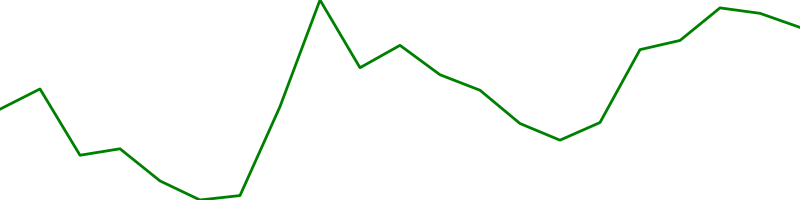 |
United States | Health Care | |||
| ☆ | 91 |  |
Hermes HESAF | Company | $204,876,942,042 | $1,885.07 | — | -$1,622,657,958 | +$18,492,571,986 | — | -0.8% | +9.9% | 108,684,000 | $188,507 | 0.00% |  |
France | Consumer Cyclical | |||
| ☆ | 92 |  |
Qualcomm QCOM | Company | $204,619,193,115 | $181.40 | — | -$4,060,806,885 | +$14,539,919,312 | — | -1.9% | +7.6% | 1,128,000,000 | $2,913,791,822 | 1.42% |  |
United States | Information Technology | |||
| ☆ | 93 |  |
Intel INTC | Company | $202,658,620,636 | $49.83 | — | +$1,260,775,605 | -$1,992,821,343 | — | +0.6% | -1.0% | 4,067,000,064 | $1,663,803,829 | 0.82% | 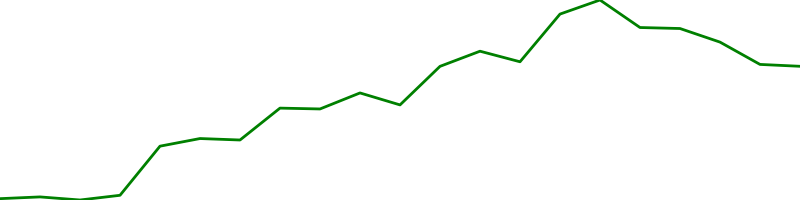 |
United States | Information Technology | |||
| ☆ | 94 |  |
Danaher DHR | Company | $201,901,385,458 | $278.13 | — | -$257,423,715 | +$9,041,886,159 | — | -0.1% | +4.7% | 725,926,016 | $693,751,019 | 0.34% | 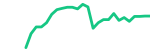 |
United States | Health Care | |||
| ☆ | 95 |  |
Wells Fargo WFC | Company | $200,717,156,392 | $50.34 | — | +$6,060,591,352 | -$2,950,556,857 | — | +3.1% | -1.4% | 3,987,229,952 | $1,437,176,800 | 0.72% | 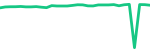 |
United States | Finance | |||
| ☆ | 96 |  |
Hermès International Société en commandite par actions 0HV2.L | Company | $194,467,413,528 | $1,857.25 | — | -$1,814,569,885 | +$15,715,612,345 | — | -0.9% | +8.8% | 104,707,000 | $25,085,919 | 0.01% |  |
France | ||||
| ☆ | 98 |  |
McDonald's MCD | Company | $189,411,657,380 | $253.48 | — | +$1,143,283,926 | +$403,507,279 | — | +0.6% | +0.2% | 747,244,992 | $618,161,666 | 0.33% |  |
United States | Consumer Services | |||
| ☆ | 100 |  |
Intuit INTU | Company | $187,501,306,681 | $661.63 | — | -$8,703,005,011 | +$10,057,614,519 | — | -4.4% | +5.7% | 283,392,992 | $1,440,368,521 | 0.77% |  |
United States | Information Technology |