The global leaderboard of wealth: $1.2 Quadrillion of Assets ranked by Market Cap
| ☆ | +/- | Asset Name | Type | Market Cap ($) | Price ($) | Market Cap 1Hr Δ ($) |
Market Cap 24Hr Δ ($) |
Market Cap 7d Δ ($) |
1Hr Change | 24Hr Change | 7d Change | Circ. Supply Max. Supply |
24Hr Volume | 24Hr Vol / Mkt Cap (%) |
Last 30 Days | Country | Sector | ||||
|---|---|---|---|---|---|---|---|---|---|---|---|---|---|---|---|---|---|---|---|---|---|
| ☆ | 13 |  |
Apple AAPL | Company | $2,415,723,352,440 | $146.14 | — | -$15,207,753,320 | +$4,628,435,696 | — | -0.6% | +0.2% | 16,530,199,552 | $7,910,090,519 | 0.33% | 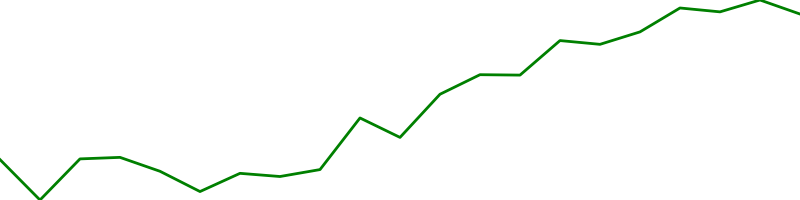 |
United States | Information Technology | |||
| ☆ | 15 |  |
Microsoft MSFT | Company | $2,175,260,064,656 | $289.46 | — | -$450,875,068 | +$34,192,658,858 | — | -0.0% | +1.6% | 7,514,890,240 | $4,801,938,636 | 0.22% | 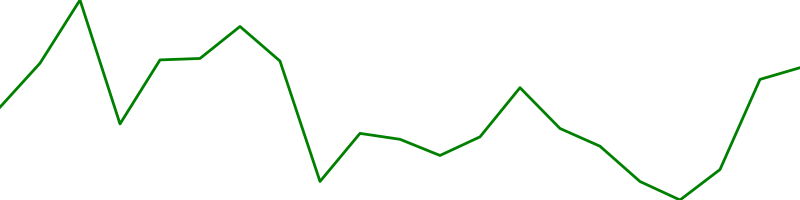 |
United States | Information Technology | |||
| ☆ | 19 |  |
Saudi Arabian Oil 2222.SR | Company | $1,545,673,301,572 | $7.73 | — | +$4,409,951,666 | +$9,067,549,791 | — | +0.3% | +0.6% | 199,882,997,760 | $37,077,260 | 0.00% | 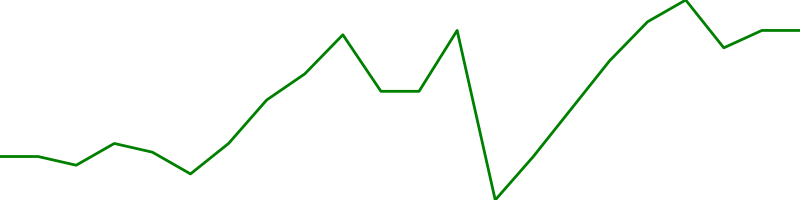 |
Saudi Arabia | Energy minerals | |||
| ☆ | 24 |  |
Meta Platforms META | Company | $983,774,363,100 | $363.51 | — | +$1,461,435,856 | +$19,512,625,742 | — | +0.1% | +2.0% | 2,706,319,872 | $3,244,326,837 | 0.33% | 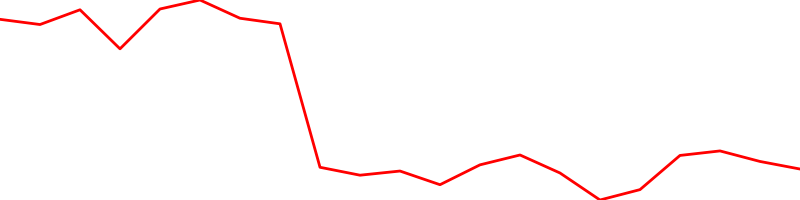 |
United States | Communication Services | |||
| ☆ | 27 |  |
Berkshire Hathaway BRK-B | Company | $652,887,343,421 | $285.63 | — | +$12,388,958,119 | +$16,777,616,594 | — | +1.9% | +2.6% | 2,285,779,968 | $1,380,135,621 | 0.21% |  |
United States | Financials | |||
| ☆ | 33 |  |
Taiwan Semiconductor Manufacturing TSM | Company | $613,037,040,121 | $118.21 | — | -$5,237,870,949 | +$8,142,018,216 | — | -0.8% | +1.3% | 5,185,999,872 | $512,806,797 | 0.08% | 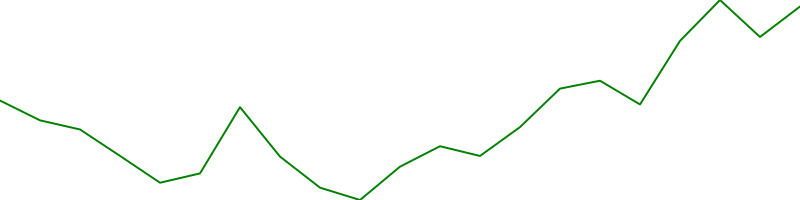 |
Taiwan | Technology | |||
| ☆ | 36 |  |
Tencent TCTZF | Company | $554,397,102,336 | $57.75 | — | +$3,839,994,578 | -$32,255,837,268 | — | +0.7% | -5.5% | 9,599,949,824 | $2,558,325 | 0.00% |  |
China | Communication Services | |||
| ☆ | 37 |  |
Alibaba BABA | Company | $533,823,387,394 | $196.39 | — | -$7,855,538,818 | +$3,261,807,820 | — | -1.5% | +0.6% | 2,718,180,096 | $2,350,336,596 | 0.44% |  |
China | Consumer Services | |||
| ☆ | 39 |  |
Visa V | Company | $529,725,736,469 | $241.40 | — | +$2,611,295,993 | -$10,950,018,234 | — | +0.5% | -2.0% | 2,194,390,016 | $1,088,641,552 | 0.21% | 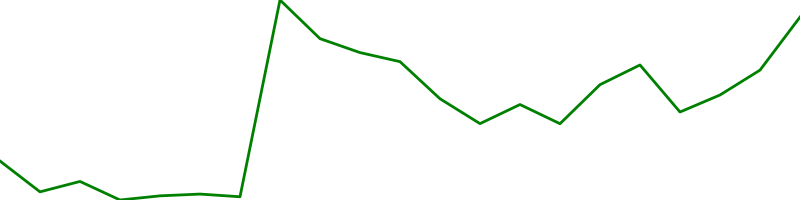 |
United States | Miscellaneous | |||
| ☆ | 41 |  |
JP Morgan Chase JPM | Company | $470,635,200,000 | $157.50 | — | +$12,998,514,238 | +$17,092,278,848 | — | +2.8% | +3.8% | 2,988,160,000 | $2,099,286,000 | 0.45% | 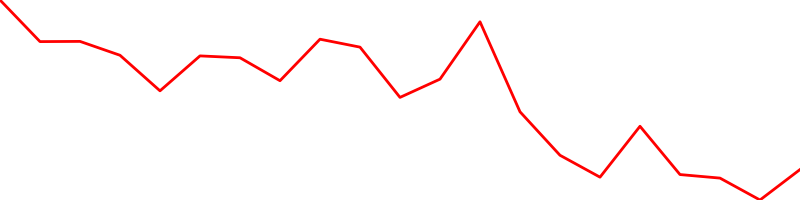 |
United States | Finance | |||
| ☆ | 44 |  |
Johnson & Johnson JNJ | Company | $455,708,614,407 | $173.11 | — | -$1,526,843,220 | +$2,395,566,440 | — | -0.3% | +0.5% | 2,632,480,000 | $793,034,224 | 0.17% | 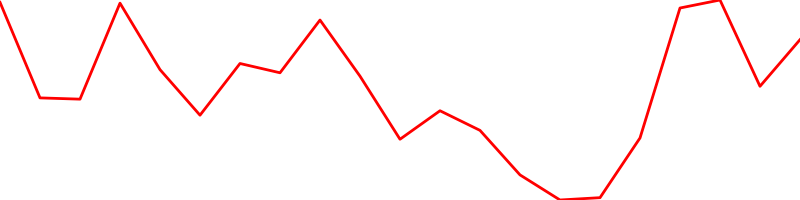 |
United States | Health Care | |||
| ☆ | 46 |  |
LVMH-Moet Hennessy Louis Vuitto LVMHF | Company | $415,582,306,991 | $824.92 | — | -$513,870,531 | +$5,450,957,303 | — | -0.1% | +1.3% | 503,784,992 | $412,460 | 0.00% |  |
France | Consumer Cyclical | |||
| ☆ | 47 |  |
UnitedHealth UNH | Company | $391,423,697,115 | $415.12 | — | +$3,705,656,872 | +$2,734,453,522 | — | +1.0% | +0.7% | 942,916,992 | $806,993,271 | 0.21% | 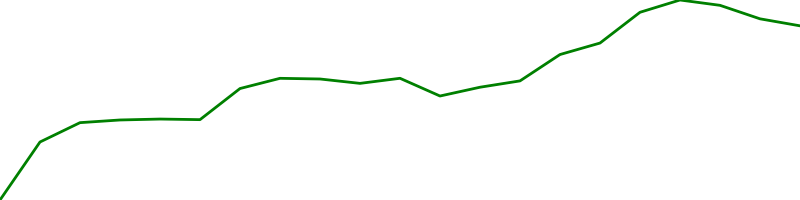 |
United States | Health Care | |||
| ☆ | 48 |  |
Mastercard MA | Company | $369,576,830,557 | $374.53 | — | +$2,555,743,574 | -$11,259,106,090 | — | +0.7% | -3.0% | 986,774,976 | $763,479,403 | 0.21% | 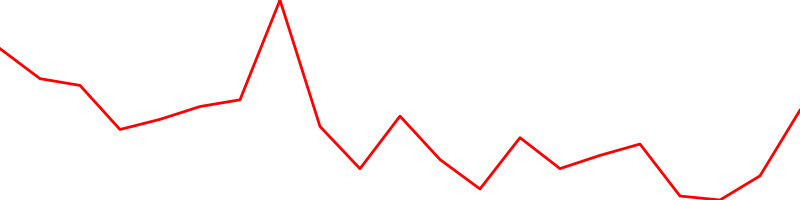 |
United States | Miscellaneous | |||
| ☆ | 49 |  |
Home Depot HD | Company | $350,705,685,061 | $329.84 | — | -$3,476,848,623 | +$1,754,372,563 | — | -1.0% | +0.5% | 1,063,260,032 | $876,252,934 | 0.25% | 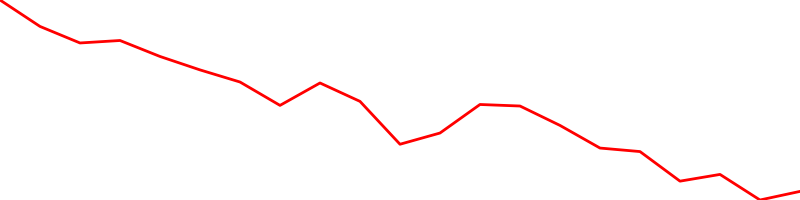 |
United States | Consumer Services | |||
| ☆ | 50 |  |
AstraZeneca AZN | Company | $349,728,195,697 | $112.88 | — | -$12,207,033,827 | -$4,957,186,936 | — | -3.4% | -1.4% | 3,098,230,016 | $351,068,079 | 0.10% |  |
United Kingdom | Healthcare | |||
| ☆ | 52 |  |
Procter & Gamble PG | Company | $343,583,899,473 | $141.41 | — | -$2,648,364,207 | -$1,992,334,800 | — | -0.8% | -0.6% | 2,429,700,096 | $852,716,463 | 0.25% | 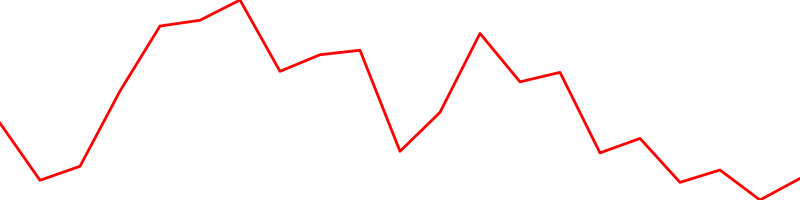 |
United States | Consumer Non-Durables | |||
| ☆ | 53 |  |
Nestle S.A NSRGF | Company | $341,908,243,264 | $123.90 | — | -$965,838,272 | -$8,278,649,856 | — | -0.3% | -2.4% | 2,759,549,952 | $594,720 | 0.00% |  |
Switzerland | Consumer Defensive | |||
| ☆ | 54 |  |
Roche RHHBY | Company | $337,954,606,859 | $48.51 | — | -$6,130,703,469 | +$1,741,675,008 | — | -1.8% | +0.5% | 6,966,700,032 | $101,128,794 | 0.03% |  |
Switzerland | Healthcare | |||
| ☆ | 55 |  |
Bank of America BAC | Company | $337,858,256,834 | $40.15 | — | +$9,508,846,241 | +$15,062,679,105 | — | +2.9% | +4.7% | 8,414,900,224 | $2,329,595,434 | 0.69% | 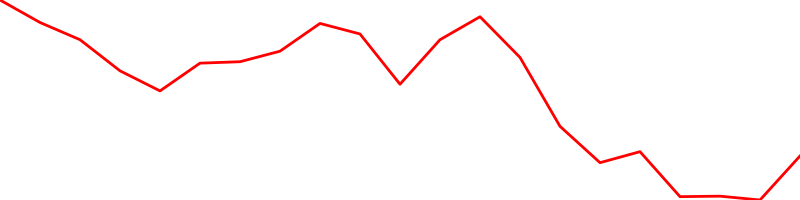 |
United States | Finance | |||
| ☆ | 56 |  |
PayPal PYPL | Company | $328,467,900,713 | $279.54 | — | -$1,327,789,656 | +$4,711,881,839 | — | -0.4% | +1.5% | 1,175,030,016 | $1,701,364,354 | 0.52% |  |
United States | Financials | |||
| ☆ | 57 |  |
ASML Holding N.V ASMLF | Company | $325,327,446,030 | $787.92 | — | -$891,865,187 | +$12,258,824,343 | — | -0.3% | +3.9% | 412,894,016 | $157,584 | 0.00% | 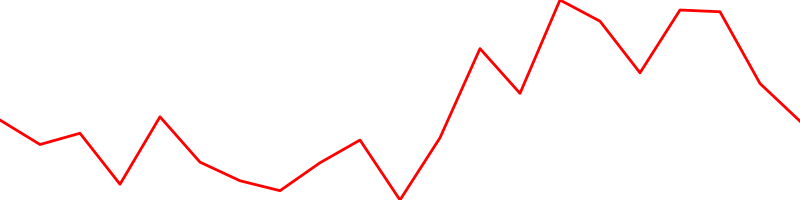 |
Netherlands | Technology | |||
| ☆ | 58 |  |
Kweichow Moutai 600519.SS | Company | $324,924,565,065 | $258.66 | — | -$5,444,576,793 | -$1,806,522,631 | — | -1.6% | -0.6% | 1,256,199,936 | $1,181,701,714 | 0.36% |  |
China | Consumer Defensive | |||
| ☆ | 59 |  |
Walt Disney DIS | Company | $321,832,828,274 | $177.13 | — | +$763,107,293 | +$2,016,793,462 | — | +0.2% | +0.6% | 1,816,930,048 | $975,136,103 | 0.30% |  |
United States | Consumer Services | |||
| ☆ | 61 |  |
Adobe ADBE | Company | $300,789,434,326 | $631.38 | — | -$333,485,815 | +$4,644,900,000 | — | -0.1% | +1.6% | 476,400,000 | $712,007,232 | 0.24% |  |
United States | Information Technology | |||
| ☆ | 64 |  |
Nike NKE | Company | $273,335,033,768 | $172.80 | — | -$1,660,894,760 | +$8,367,735,178 | — | -0.6% | +3.2% | 1,581,799,936 | $706,527,372 | 0.26% |  |
United States | Consumer Non-Durables | |||
| ☆ | 66 |  |
L'Oreal LRLCF | Company | $262,963,916,435 | $470.57 | — | +$95,006,898 | +$6,085,557,637 | — | +0.0% | +2.4% | 558,819,968 | $141,171 | 0.00% |  |
France | Consumer Defensive | |||
| ☆ | 67 |  |
Comcast CMCSA | Company | $253,497,352,184 | $55.00 | — | +$1,511,738,684 | -$604,702,506 | — | +0.6% | -0.2% | 4,608,650,240 | $621,474,278 | 0.25% | 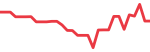 |
United States | Communication Services | |||
| ☆ | 68 |  |
Pfizer PFE | Company | $252,287,880,102 | $45.07 | — | +$55,967,503 | +$12,650,769,679 | — | +0.0% | +5.3% | 5,597,689,856 | $920,013,904 | 0.36% | 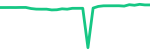 |
United States | Health Care | |||
| ☆ | 69 |  |
Eli Lilly and LLY | Company | $252,001,698,868 | $263.44 | — | -$717,435,744 | +$19,074,227,316 | — | -0.3% | +8.2% | 956,580,992 | $567,765,893 | 0.23% | 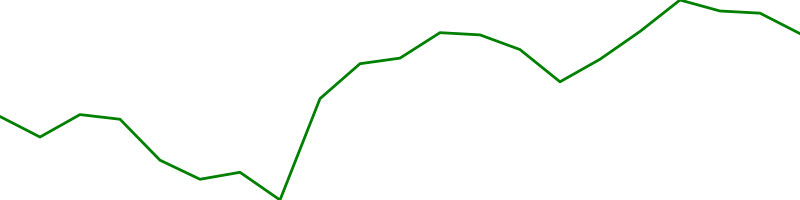 |
United States | Health Care | |||
| ☆ | 70 |  |
Oracle ORCL | Company | $249,939,830,627 | $89.52 | — | +$251,269,775 | +$6,644,952,332 | — | +0.1% | +2.7% | 2,792,000,000 | $583,124,306 | 0.23% | 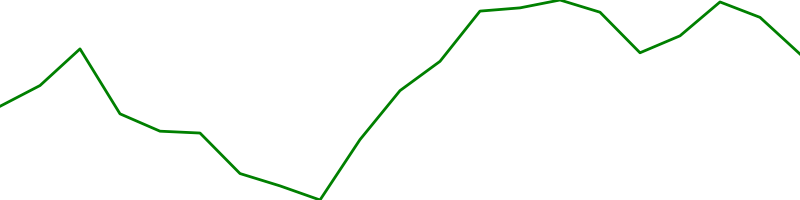 |
United States | Technology | |||
| ☆ | 72 |  |
Exxon Mobil XOM | Company | $244,953,787,887 | $57.86 | — | +$2,794,148,996 | +$1,227,736,294 | — | +1.2% | +0.5% | 4,233,560,064 | $861,448,619 | 0.35% | 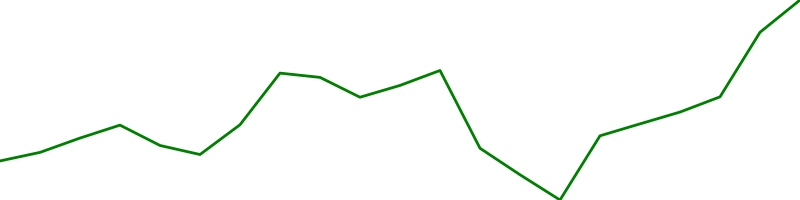 |
United States | Energy | |||
| ☆ | 73 |  |
Coca-Cola KO | Company | $244,493,341,478 | $56.64 | — | +$604,324,134 | -$1,683,479,078 | — | +0.2% | -0.7% | 4,316,619,776 | $589,582,746 | 0.24% | 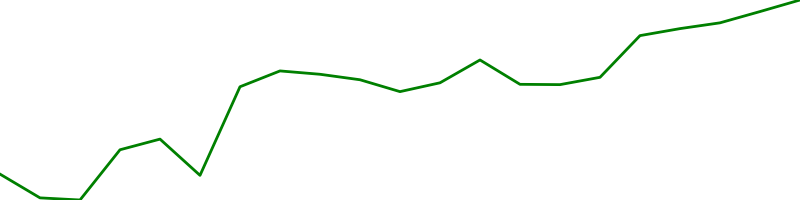 |
United States | Consumer Non-Durables | |||
| ☆ | 74 |  |
Salesforce.com CRM | Company | $243,455,454,566 | $250.59 | — | +$29,144,685 | +$8,413,444,906 | — | +0.0% | +3.6% | 971,529,024 | $1,013,736,771 | 0.42% |  |
United States | Technology | |||
| ☆ | 76 |  |
Cisco CSCO | Company | $237,093,567,135 | $55.59 | — | -$725,048,969 | +$938,313,978 | — | -0.3% | +0.4% | 4,265,039,872 | $1,022,083,302 | 0.43% | 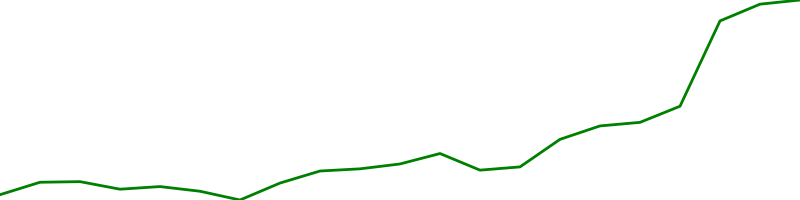 |
United States | Information Technology | |||
| ☆ | 78 |  |
Tesla TSLA | Company | $230,706,496,957 | $233.03 | — | -$5,124,977,123 | +$3,927,067,462 | — | -2.2% | +1.7% | 990,014,976 | $10,922,039,634 | 4.73% | 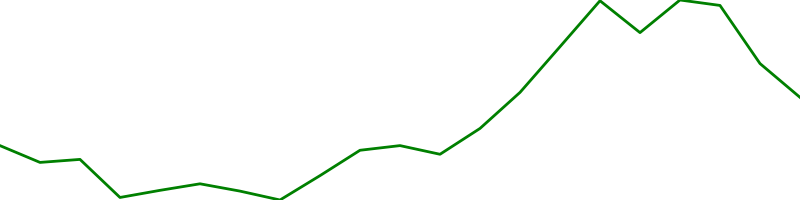 |
United States | Consumer Discretionary | |||
| ☆ | 79 |  |
Verizon VZ | Company | $228,617,434,988 | $55.22 | — | -$331,201,393 | -$2,318,457,128 | — | -0.1% | -1.0% | 4,140,120,064 | $699,101,781 | 0.31% |  |
United States | Communication Services | |||
| ☆ | 81 |  |
Intel INTC | Company | $218,753,429,121 | $53.92 | — | +$121,705,046 | +$811,387,606 | — | +0.1% | +0.4% | 4,056,999,936 | $1,038,283,485 | 0.47% | 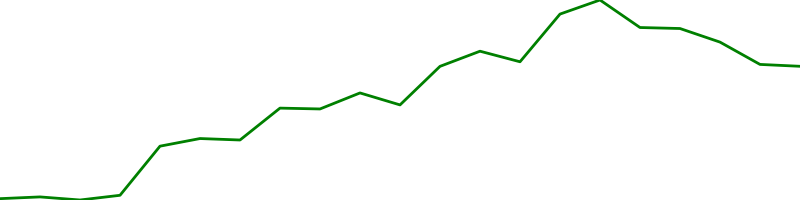 |
United States | Information Technology | |||
| ☆ | 82 |  |
Abbott Laboratories ABT | Company | $216,585,412,244 | $122.17 | — | -$70,914,422 | +$2,109,646,565 | — | -0.0% | +1.0% | 1,772,819,968 | $433,740,144 | 0.20% |  |
United States | Health Care | |||
| ☆ | 83 |  |
PepsiCo PEP | Company | $213,301,031,423 | $154.33 | — | +$27,648,104 | -$3,621,121,326 | — | +0.0% | -1.7% | 1,382,109,952 | $529,490,803 | 0.25% |  |
United States | Consumer Staples | |||
| ☆ | 84 |  |
Thermo Fisher Scientific TMO | Company | $212,985,120,031 | $538.20 | — | -$1,642,289,908 | -$716,281,194 | — | -0.8% | -0.3% | 395,736,000 | $412,153,569 | 0.19% |  |
United States | Capital Goods | |||
| ☆ | 85 |  |
Novartis NVS | Company | $204,259,104,884 | $91.32 | — | -$2,080,168,972 | -$2,393,311,220 | — | -1.0% | -1.2% | 2,236,740,096 | $119,839,236 | 0.06% | 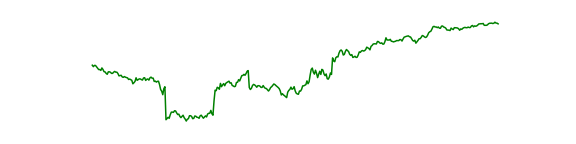 |
Switzerland | Health Care | |||
| ☆ | 86 |  |
Accenture plc Class A Ordinary Shares (Ireland) ACN | Company | $204,084,309,919 | $321.83 | — | +$963,881,310 | +$2,631,664,779 | — | +0.5% | +1.3% | 634,137,024 | $448,180,439 | 0.22% |  |
Ireland | Technology | |||
| ☆ | 87 |  |
AbbVie ABBV | Company | $202,253,749,269 | $114.45 | — | -$1,184,020,868 | -$3,269,293,845 | — | -0.6% | -1.6% | 1,767,180,032 | $611,208,764 | 0.30% | 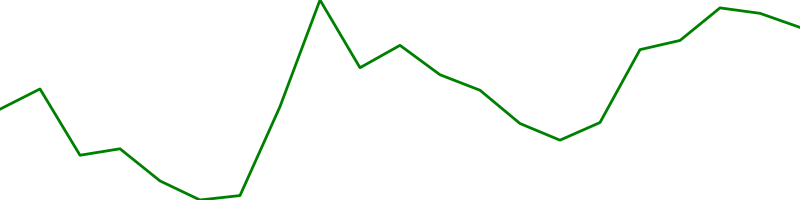 |
United States | Health Care | |||
| ☆ | 88 |  |
Wells Fargo WFC | Company | $200,269,616,799 | $48.77 | — | +$7,309,404,759 | +$11,621,147,774 | — | +3.8% | +6.2% | 4,106,409,984 | $1,637,886,818 | 0.82% |  |
United States | Finance | |||
| ☆ | 89 |  |
BHP BHPLF | Company | $199,480,372,237 | $38.71 | — | +$1,185,233,670 | -$8,708,920,797 | — | +0.6% | -4.2% | 5,153,200,128 | $3,901,968 | 0.00% |  |
Australia | Basic Materials | |||
| ☆ | 90 |  |
Chevron CVX | Company | $196,565,714,378 | $101.95 | — | +$1,388,190,867 | +$269,927,228 | — | +0.7% | +0.1% | 1,928,060,032 | $660,187,400 | 0.34% | 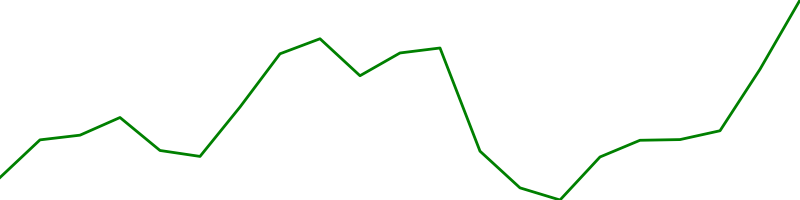 |
United States | Energy | |||
| ☆ | 91 |  |
Danaher DHR | Company | $194,474,468,938 | $272.41 | — | +$88,605,696 | +$6,195,993,454 | — | +0.0% | +3.3% | 713,900,032 | $510,514,935 | 0.26% |  |
United States | Health Care | |||
| ☆ | 92 |  |
Costco COST | Company | $194,346,793,112 | $439.63 | — | -$1,573,764,532 | +$4,380,905,330 | — | -0.8% | +2.3% | 442,068,992 | $786,849,783 | 0.40% | 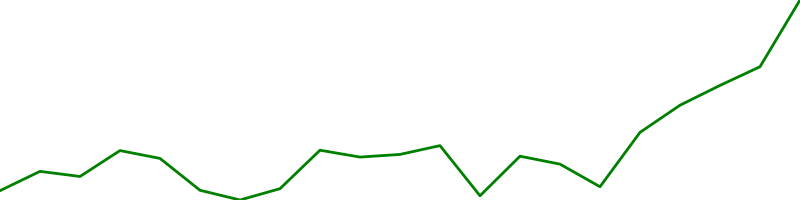 |
United States | Consumer Staples | |||
| ☆ | 95 |  |
China Construction Bank CICHF | Company | $182,111,994,031 | $0.70 | — | +$5,203,194,956 | -$2,601,597,478 | — | +2.9% | -1.4% | 260,159,995,904 | $1,400 | 0.00% |  |
China | Financial Services | |||
| ☆ | 96 |  |
Morgan Stanley MS | Company | $181,963,374,925 | $99.73 | — | +$3,466,666,784 | +$6,842,100,000 | — | +1.9% | +3.9% | 1,824,560,000 | $929,274,198 | 0.51% | 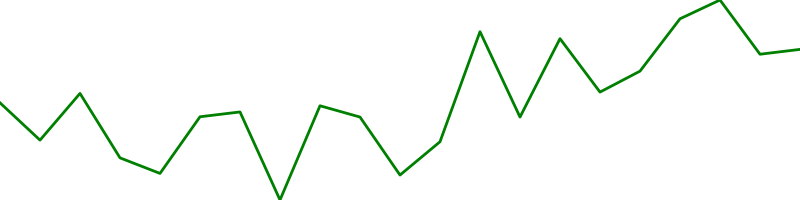 |
United States | Finance | |||
| ☆ | 97 |  |
Texas Instruments TXN | Company | $179,441,037,227 | $192.96 | — | -$185,984,964 | +$2,176,068,063 | — | -0.1% | +1.2% | 929,939,008 | $465,863,344 | 0.26% |  |
United States | Information Technology | |||
| ☆ | 98 |  |
T-Mobile US TMUS | Company | $177,498,774,595 | $142.23 | — | +$374,394,823 | -$2,233,877,050 | — | +0.2% | -1.2% | 1,247,970,048 | $744,815,819 | 0.42% |  |
United States | Communication Services | |||
| ☆ | 99 |  |
McDonald's MCD | Company | $176,438,721,967 | $236.26 | — | -$119,490,571 | -$4,816,862,511 | — | -0.1% | -2.7% | 746,798,976 | $368,234,827 | 0.21% |  |
United States | Consumer Services | |||
| ☆ | 100 |  |
SAP SE SAPGF | Company | $174,193,210,817 | $146.61 | — | -$1,413,889,539 | +$5,002,077,512 | — | -0.8% | +3.0% | 1,188,140,032 | $73,305 | 0.00% |  |
Germany | Technology |