The global leaderboard of wealth: $1.2 Quadrillion of Assets ranked by Market Cap
| ☆ | +/- | Asset Name | Type | Market Cap ($) | Price ($) | Market Cap 1Hr Δ ($) |
Market Cap 24Hr Δ ($) |
Market Cap 7d Δ ($) |
1Hr Change | 24Hr Change | 7d Change | Circ. Supply Max. Supply |
24Hr Volume | 24Hr Vol / Mkt Cap (%) |
Last 30 Days | Country | Sector | ||||
|---|---|---|---|---|---|---|---|---|---|---|---|---|---|---|---|---|---|---|---|---|---|
| ☆ | 14 |  |
Apple AAPL | Company | $1,972,260,276,330 | $115.32 | — | +$70,462,346,314 | -$7,354,080,150 | — | +3.7% | -0.4% | 17,102,499,840 | $16,851,619,299 | 0.85% | 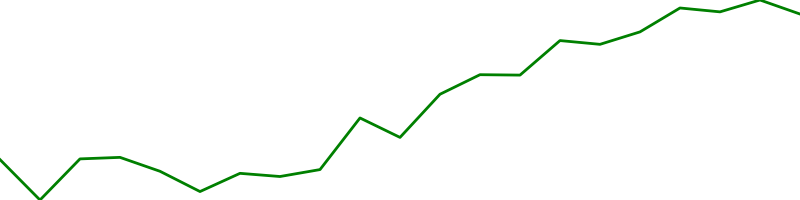 |
United States | Information Technology | |||
| ☆ | 17 |  |
Saudi Arabian Oil 2222.SR | Company | $1,634,615,436,658 | $7.43 | — | -$24,252,463,186 | -$77,628,381,583 | — | -1.5% | -4.5% | 219,871,002,624 | $58,275,042 | 0.00% | 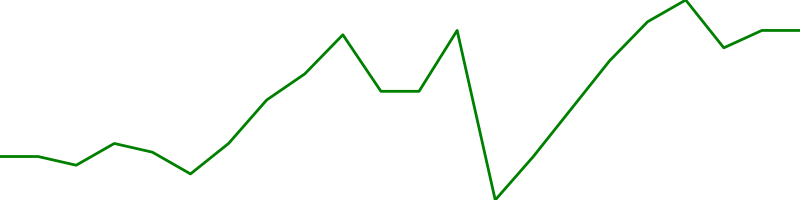 |
Saudi Arabia | Energy minerals | |||
| ☆ | 19 |  |
Microsoft MSFT | Company | $1,547,785,615,086 | $204.72 | — | +$15,423,485,061 | -$76,890,273,434 | — | +1.0% | -4.7% | 7,560,500,224 | $6,434,881,910 | 0.42% | 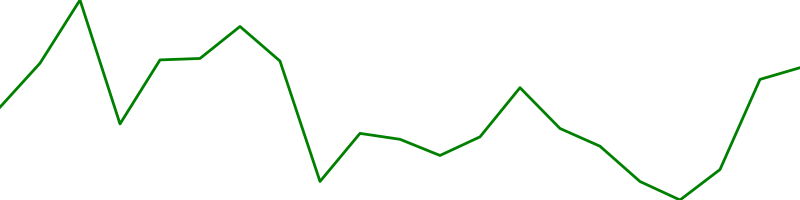 |
United States | Information Technology | |||
| ☆ | 24 |  |
Alibaba BABA | Company | $871,298,530,400 | $312.56 | — | +$12,878,791,232 | +$17,506,250,800 | — | +1.5% | +2.1% | 2,787,620,096 | $3,492,701,693 | 0.40% |  |
China | Consumer Services | |||
| ☆ | 26 |  |
Tencent TCTZF | Company | $769,125,118,171 | $78.92 | — | +$26,118,291,932 | +$65,977,883,793 | — | +3.5% | +9.4% | 9,745,630,208 | $2,888,472 | 0.00% |  |
China | Communication Services | |||
| ☆ | 27 |  |
Meta Platforms META | Company | $760,015,773,314 | $280.83 | — | +$35,615,096,836 | +$7,334,103,728 | — | +4.9% | +1.0% | 2,706,319,872 | $9,089,933,088 | 1.20% | 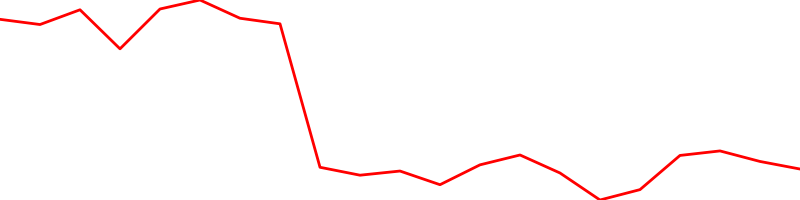 |
United States | Communication Services | |||
| ☆ | 36 |  |
Berkshire Hathaway BRK-B | Company | $481,705,585,875 | $201.51 | — | +$1,936,282,860 | -$24,143,861,298 | — | +0.4% | -4.8% | 2,390,479,872 | $1,052,768,815 | 0.22% |  |
United States | Financials | |||
| ☆ | 40 |  |
Visa V | Company | $411,198,953,087 | $184.87 | — | +$8,897,040,384 | -$29,182,315,538 | — | +2.2% | -6.6% | 2,224,260,096 | $3,109,679,701 | 0.76% | 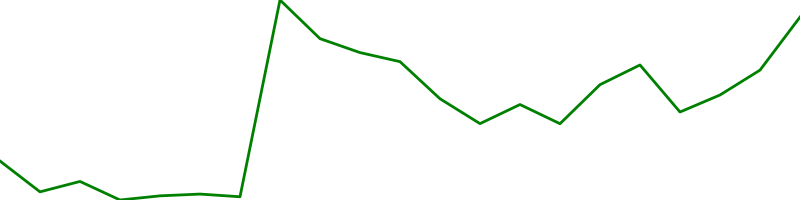 |
United States | Miscellaneous | |||
| ☆ | 41 |  |
Taiwan Semiconductor Manufacturing TSM | Company | $407,167,229,748 | $84.89 | — | +$4,988,270,641 | -$15,924,079,258 | — | +1.2% | -3.8% | 4,796,409,856 | $496,232,980 | 0.12% | 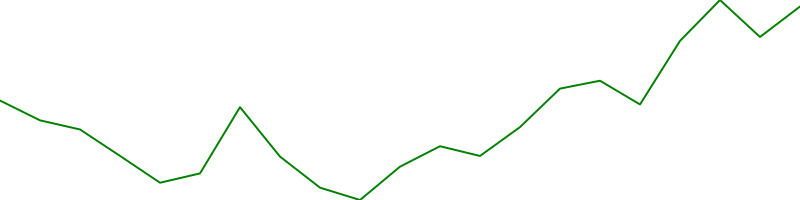 |
Taiwan | Technology | |||
| ☆ | 43 |  |
Johnson & Johnson JNJ | Company | $361,158,155,857 | $137.19 | — | -$3,080,066,867 | -$20,770,738,236 | — | -0.8% | -5.4% | 2,632,539,904 | $988,508,844 | 0.27% | 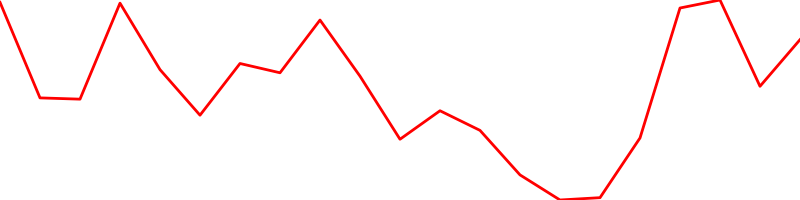 |
United States | Health Care | |||
| ☆ | 44 |  |
Procter & Gamble PG | Company | $341,119,981,269 | $137.57 | — | -$223,155,829 | -$9,620,861,506 | — | -0.1% | -2.7% | 2,479,610,112 | $753,457,173 | 0.22% | 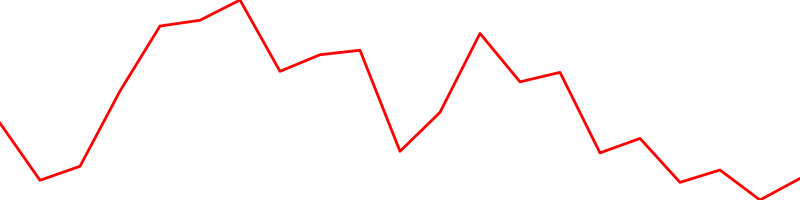 |
United States | Consumer Non-Durables | |||
| ☆ | 45 |  |
Nestle S.A NSRGF | Company | $327,076,591,202 | $113.71 | — | -$661,583,982 | -$12,339,802,014 | — | -0.2% | -3.6% | 2,876,410,112 | $1,751,134 | 0.00% |  |
Switzerland | Consumer Defensive | |||
| ☆ | 46 |  |
Kweichow Moutai 600519.SS | Company | $312,934,365,830 | $249.11 | — | +$2,089,330,082 | -$16,227,781,665 | — | +0.7% | -4.9% | 1,256,199,936 | $980,847,257 | 0.31% |  |
China | Consumer Defensive | |||
| ☆ | 47 |  |
JP Morgan Chase JPM | Company | $296,193,582,200 | $97.17 | — | +$1,920,357,588 | -$17,405,218,844 | — | +0.7% | -5.6% | 3,048,199,936 | $1,380,669,070 | 0.47% | 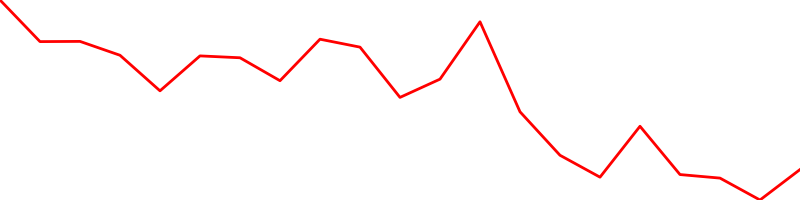 |
United States | Finance | |||
| ☆ | 48 |  |
Mastercard MA | Company | $292,278,461,853 | $293.18 | — | +$1,794,452,816 | -$40,295,721,563 | — | +0.6% | -12.1% | 996,924,992 | $2,809,338,644 | 0.96% | 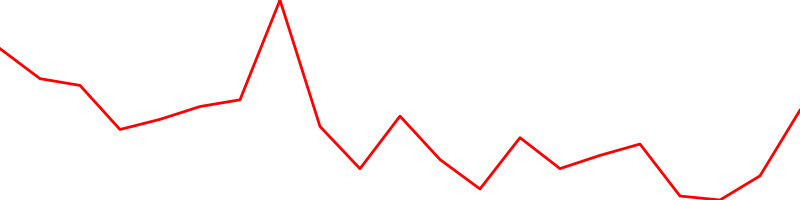 |
United States | Miscellaneous | |||
| ☆ | 50 |  |
Home Depot HD | Company | $290,245,923,684 | $269.63 | — | -$96,877,461 | -$12,411,582,855 | — | -0.0% | -4.1% | 1,076,460,032 | $774,512,189 | 0.27% | 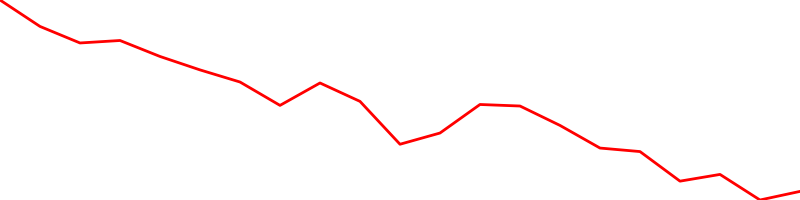 |
United States | Consumer Services | |||
| ☆ | 51 |  |
UnitedHealth UNH | Company | $288,598,029,520 | $303.68 | — | -$4,105,458,480 | -$20,954,926,201 | — | -1.4% | -6.8% | 950,336,000 | $995,827,432 | 0.35% | 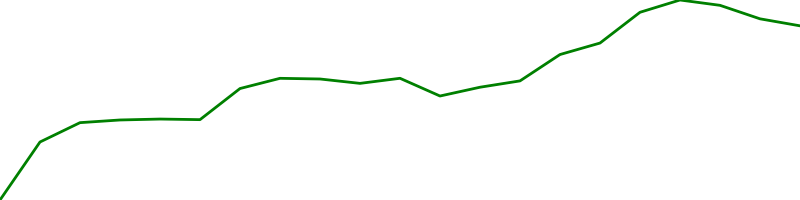 |
United States | Health Care | |||
| ☆ | 52 |  |
Roche RHHVF | Company | $282,473,485,820 | $326.80 | — | +$5,402,262,400 | -$1,746,028,090 | — | +1.9% | -0.6% | 864,361,984 | $196,080 | 0.00% | 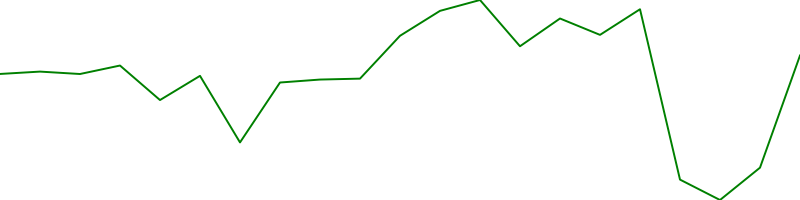 |
Switzerland | Healthcare | |||
| ☆ | 56 |  |
LVMH-Moet Hennessy Louis Vuitto LVMUY | Company | $240,794,446,022 | $94.77 | — | +$2,210,509,652 | -$14,584,377,882 | — | +0.9% | -5.7% | 2,540,829,952 | $13,542,633 | 0.01% |  |
France | Consumer Cyclical | |||
| ☆ | 58 |  |
Verizon VZ | Company | $234,877,980,546 | $56.76 | — | +$1,862,127,864 | -$2,358,725,814 | — | +0.8% | -1.0% | 4,138,089,984 | $1,086,732,604 | 0.46% | 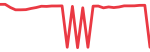 |
United States | Communication Services | |||
| ☆ | 60 |  |
PayPal PYPL | Company | $228,840,417,881 | $195.04 | — | +$3,203,103,900 | -$10,430,635,999 | — | +1.4% | -4.4% | 1,173,299,968 | $1,487,589,533 | 0.65% |  |
United States | Financials | |||
| ☆ | 62 |  |
Meituan 3690.HK | Company | $225,524,340,275 | $38.35 | — | +$13,051,888,447 | +$21,391,123,356 | — | +6.1% | +10.5% | 5,881,010,176 | $1,229,808,560 | 0.55% |  |
China | Consumer Cyclical | |||
| ☆ | 64 |  |
Walt Disney DIS | Company | $219,630,070,165 | $121.54 | — | +$5,547,673,550 | -$10,878,494,941 | — | +2.6% | -4.7% | 1,807,059,968 | $1,164,802,907 | 0.53% |  |
United States | Consumer Services | |||
| ☆ | 65 |  |
Salesforce.com CRM | Company | $215,603,422,719 | $237.14 | — | -$1,172,838,697 | -$11,392,049,551 | — | -0.5% | -5.0% | 909,182,016 | $1,088,235,457 | 0.50% | 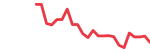 |
United States | Technology | |||
| ☆ | 67 |  |
Adobe ADBE | Company | $212,116,126,582 | $461.11 | — | +$1,904,442,380 | -$10,345,679,426 | — | +0.9% | -4.7% | 460,012,000 | $979,997,052 | 0.46% | 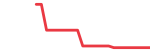 |
United States | Information Technology | |||
| ☆ | 68 |  |
Coca-Cola KO | Company | $206,362,591,336 | $48.02 | — | +$257,851,703 | -$11,431,163,187 | — | +0.1% | -5.2% | 4,297,430,016 | $738,062,605 | 0.36% | 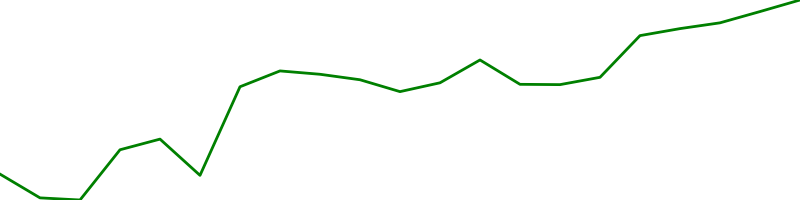 |
United States | Consumer Non-Durables | |||
| ☆ | 69 |  |
Bank of America BAC | Company | $203,892,197,769 | $23.54 | — | +$606,320,304 | -$11,519,821,450 | — | +0.3% | -5.3% | 8,661,520,384 | $1,353,324,069 | 0.66% | 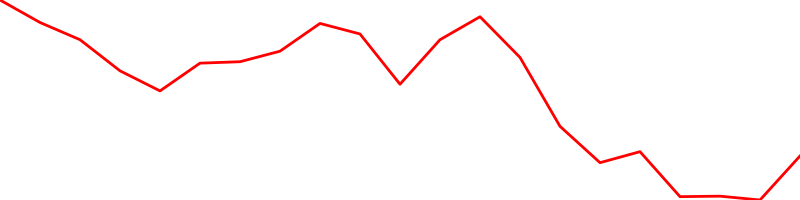 |
United States | Finance | |||
| ☆ | 70 |  |
Nike NKE | Company | $192,869,316,724 | $122.86 | — | +$1,224,465,496 | -$11,239,988,663 | — | +0.6% | -5.5% | 1,569,830,016 | $607,788,423 | 0.32% |  |
United States | Consumer Non-Durables | |||
| ☆ | 72 |  |
Pfizer PFE | Company | $186,967,251,811 | $33.47 | — | -$900,934,451 | -$11,393,980,477 | — | -0.5% | -5.7% | 5,585,699,840 | $922,011,002 | 0.49% |  |
United States | Health Care | |||
| ☆ | 73 |  |
Thermo Fisher Scientific TMO | Company | $186,670,535,477 | $471.88 | — | -$1,910,689,519 | -$3,999,398,914 | — | -1.0% | -2.1% | 395,588,992 | $627,647,594 | 0.34% |  |
United States | Capital Goods | |||
| ☆ | 74 |  |
PepsiCo PEP | Company | $185,168,819,416 | $133.99 | — | -$248,742,667 | -$7,766,608,092 | — | -0.1% | -4.0% | 1,381,959,936 | $516,732,456 | 0.28% |  |
United States | Consumer Staples | |||
| ☆ | 75 |  |
L'Oreal LRLCY | Company | $184,767,566,131 | $65.41 | — | +$1,045,168,982 | -$9,039,223,584 | — | +0.6% | -4.7% | 2,824,760,064 | $8,594,874 | 0.00% |  |
France | Consumer Defensive | |||
| ☆ | 76 |  |
Comcast CMCSA | Company | $184,350,877,302 | $40.36 | — | +$4,623,758,222 | -$8,776,563,585 | — | +2.6% | -4.5% | 4,568,099,840 | $876,460,503 | 0.48% |  |
United States | Communication Services | |||
| ☆ | 77 |  |
Abbott Laboratories ABT | Company | $183,334,206,720 | $105.00 | — | -$2,479,373,694 | -$7,822,265,348 | — | -1.3% | -4.1% | 1,746,040,064 | $444,948,000 | 0.24% |  |
United States | Health Care | |||
| ☆ | 78 |  |
China Construction Bank CICHF | Company | $181,678,760,587 | $0.73 | — | — | — | — | — | — | 248,875,008,000 | — | — |  |
China | Financial Services | |||
| ☆ | 79 |  |
Intel INTC | Company | $180,762,776,855 | $44.11 | — | -$573,717,481 | -$40,119,422,499 | — | -0.3% | -18.2% | 4,097,999,872 | $1,623,106,870 | 0.90% |  |
United States | Information Technology | |||
| ☆ | 80 |  |
Novartis NVS | Company | $179,083,995,347 | $78.07 | — | -$665,230,214 | -$14,543,272,005 | — | -0.4% | -7.5% | 2,293,890,048 | $127,964,536 | 0.07% |  |
Switzerland | Health Care | |||
| ☆ | 82 |  |
Unilever UL | Company | $172,384,596,313 | $64.98 | — | -$1,971,809,198 | -$11,562,018,115 | — | -1.1% | -6.3% | 2,652,989,952 | $82,412,885 | 0.05% |  |
United Kingdom | Consumer Non-Durables | |||
| ☆ | 83 |  |
Oracle ORCL | Company | $168,670,058,282 | $56.02 | — | +$1,294,683,612 | -$11,049,960,728 | — | +0.8% | -6.1% | 3,010,889,984 | $760,398,680 | 0.45% |  |
United States | Technology | |||
| ☆ | 85 |  |
Costco COST | Company | $160,986,441,617 | $364.86 | — | -$44,125,493 | -$4,804,979,383 | — | -0.0% | -2.9% | 441,228,000 | $670,795,083 | 0.42% |  |
United States | Consumer Staples | |||
| ☆ | 86 |  |
Agricultural Bank of China 601288.SS | Company | $160,009,558,040 | $0.47 | — | -$1,523,899,053 | -$4,957,888,326 | — | -0.9% | -3.0% | 341,755,002,880 | $78,587,327 | 0.05% | 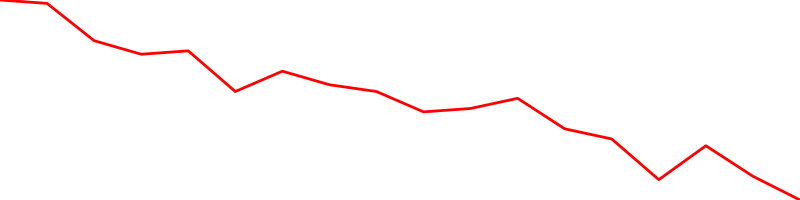 |
China | Financial Services | |||
| ☆ | 87 |  |
McDonald's MCD | Company | $159,944,932,420 | $214.95 | — | +$193,462,686 | -$10,566,259,988 | — | +0.1% | -6.2% | 744,102,976 | $532,560,112 | 0.33% |  |
United States | Consumer Services | |||
| ☆ | 88 |  |
ASML Holding N.V ASMLF | Company | $158,341,854,016 | $373.00 | — | +$6,023,783,633 | -$4,385,172,187 | — | +4.0% | -2.7% | 424,508,992 | $261,100 | 0.00% | 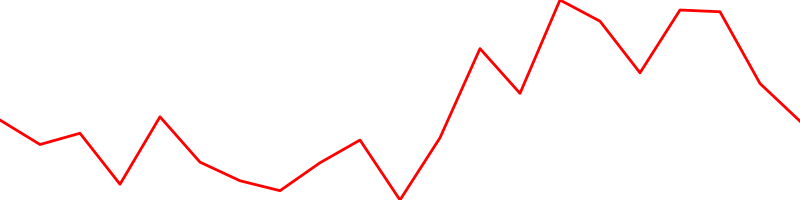 |
Netherlands | Technology | |||
| ☆ | 90 |  |
Cisco CSCO | Company | $150,648,194,577 | $35.69 | — | -$84,422,330 | -$13,211,796,808 | — | -0.1% | -8.1% | 4,221,019,904 | $1,260,999,031 | 0.84% | 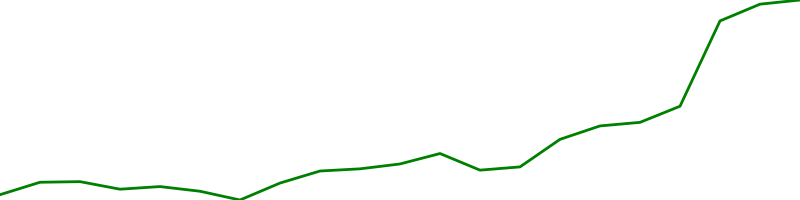 |
United States | Information Technology | |||
| ☆ | 92 |  |
NextEra Energy NEE | Company | $144,990,771,333 | $74.01 | — | -$881,575,500 | -$3,051,241,884 | — | -0.6% | -2.1% | 1,959,069,952 | $573,806,948 | 0.40% |  |
United States | Public Utilities | |||
| ☆ | 93 |  |
Danaher DHR | Company | $144,890,464,533 | $203.96 | — | -$1,278,420,663 | -$2,462,385,983 | — | -0.9% | -1.7% | 710,377,024 | $508,247,684 | 0.35% |  |
United States | Health Care | |||
| ☆ | 94 |  |
Wuliangye 000858.SZ | Company | $144,457,963,547 | $37.23 | — | +$5,824,688,736 | +$3,424,708,617 | — | +4.2% | +2.4% | 3,879,990,016 | $1,279,640,341 | 0.89% |  |
China | Consumer Defensive | |||
| ☆ | 95 |  |
AT&T T | Company | $144,013,260,761 | $20.21 | — | +$1,399,220,401 | -$8,180,130,909 | — | +1.0% | -5.4% | 7,125,320,192 | $1,182,155,047 | 0.82% |  |
United States | Consumer Services | |||
| ☆ | 96 |  |
Qualcomm QCOM | Company | $142,658,455,485 | $126.44 | — | +$5,483,392,655 | -$2,188,846,461 | — | +4.0% | -1.5% | 1,128,269,952 | $891,819,269 | 0.63% |  |
United States | Information Technology | |||
| ☆ | 97 |  |
AbbVie ABBV | Company | $141,610,536,176 | $80.67 | — | +$315,977,939 | -$6,389,764,187 | — | +0.2% | -4.3% | 1,755,430,016 | $716,083,373 | 0.51% | 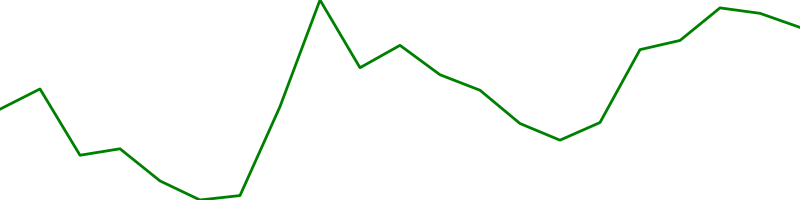 |
United States | Health Care | |||
| ☆ | 98 |  |
Exxon Mobil XOM | Company | $139,404,744,569 | $32.97 | — | +$5,919,528,295 | -$7,991,351,908 | — | +4.4% | -5.4% | 4,228,229,888 | $1,273,393,763 | 0.91% | 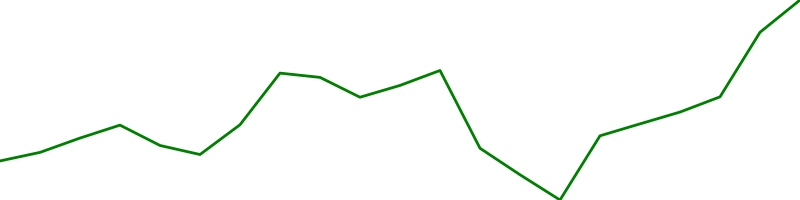 |
United States | Energy | |||
| ☆ | 99 |  |
United Parcel Service UPS | Company | $139,314,186,654 | $161.36 | — | +$4,817,633,947 | -$10,041,055,187 | — | +3.6% | -6.7% | 863,374,976 | $943,891,460 | 0.68% |  |
United States | Transportation |