The global leaderboard of wealth: $1.2 Quadrillion of Assets ranked by Market Cap
| ☆ | +/- | Asset Name | Type | Market Cap ($) | Price ($) | Market Cap 1Hr Δ ($) |
Market Cap 24Hr Δ ($) |
Market Cap 7d Δ ($) |
1Hr Change | 24Hr Change | 7d Change | Circ. Supply Max. Supply |
24Hr Volume | 24Hr Vol / Mkt Cap (%) |
Last 30 Days | Country | Sector | ||||
|---|---|---|---|---|---|---|---|---|---|---|---|---|---|---|---|---|---|---|---|---|---|
| ☆ | 20 |  |
Microsoft MSFT | Company | $745,108,635,421 | $96.77 | — | +$1,770,918,762 | +$24,100,321,001 | — | +0.2% | +3.3% | 7,699,789,824 | $2,523,151,861 | 0.34% | 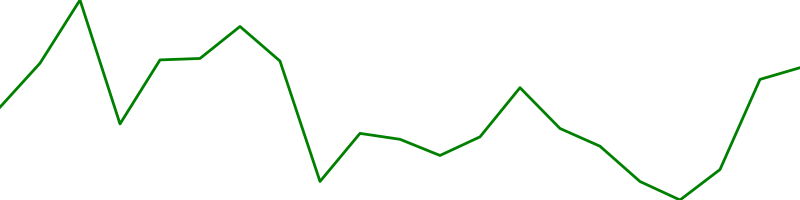 |
United States | Information Technology | |||
| ☆ | 28 |  |
Tencent TCEHY | Company | $557,657,751,474 | $58.66 | — | +$4,658,254,943 | +$29,090,240,194 | — | +0.8% | +5.5% | 9,506,610,176 | $154,123,284 | 0.03% | 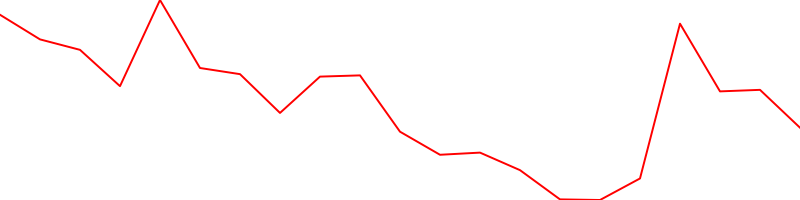 |
China | Communication Services | |||
| ☆ | 29 |  |
Berkshire Hathaway BRK-B | Company | $522,689,191,997 | $211.82 | — | -$2,763,711,277 | +$21,172,099,279 | — | -0.5% | +4.2% | 2,467,610,112 | $1,052,109,976 | 0.20% |  |
United States | Financials | |||
| ☆ | 32 |  |
Meta Platforms META | Company | $500,019,644,684 | $184.76 | — | -$1,271,973,643 | +$11,799,556,294 | — | -0.3% | +2.4% | 2,706,319,872 | $2,827,049,628 | 0.57% | 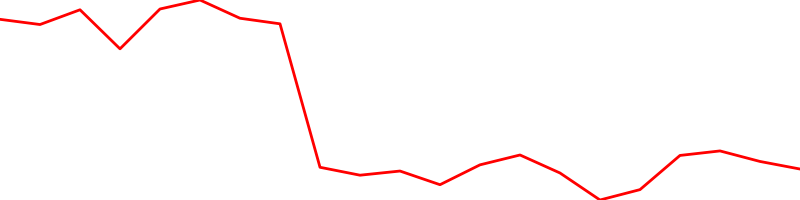 |
United States | Communication Services | |||
| ☆ | 37 |  |
JP Morgan Chase JPM | Company | $413,985,559,463 | $117.66 | — | -$1,337,016,579 | +$9,148,095,766 | — | -0.3% | +2.3% | 3,518,490,112 | $1,451,842,083 | 0.35% | 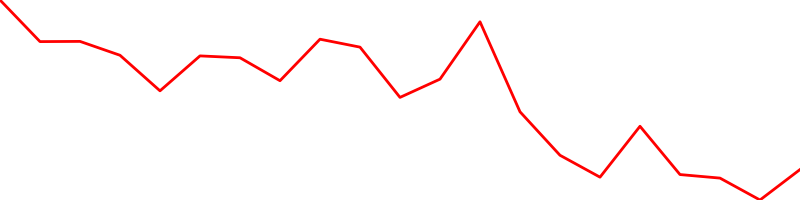 |
United States | Finance | |||
| ☆ | 39 |  |
Johnson & Johnson JNJ | Company | $355,814,463,411 | $132.63 | — | -$3,138,824,213 | +$7,619,069,329 | — | -0.9% | +2.2% | 2,682,759,936 | $655,457,484 | 0.18% | 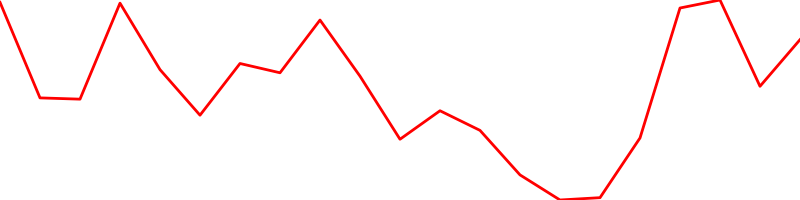 |
United States | Health Care | |||
| ☆ | 40 |  |
Banca Monte Dei Paschi S.p.a BMDPF | Company | $350,293,332,480 | $390.00 | — | — | -$67,364,102,400 | — | — | -16.1% | 898,188,032 | — | — |  |
Italy | Financial Services | |||
| ☆ | 41 |  |
China Construction Bank CICHY | Company | $338,879,763,556 | $21.72 | — | +$6,396,899,436 | +$22,623,171,495 | — | +1.9% | +7.2% | 15,602,199,552 | $1,298,856 | 0.00% |  |
China | Financial Services | |||
| ☆ | 42 |  |
Bank of America BAC | Company | $337,834,919,908 | $32.84 | — | +$1,234,464,962 | +$7,303,973,286 | — | +0.4% | +2.2% | 10,287,299,584 | $1,981,000,761 | 0.59% | 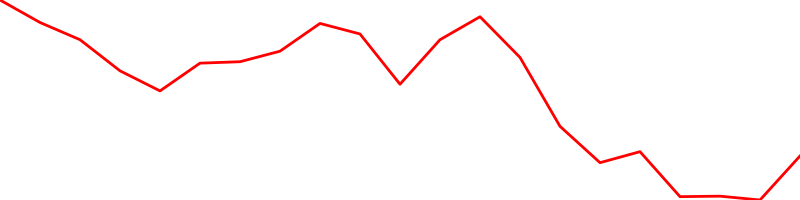 |
United States | Finance | |||
| ☆ | 43 |  |
Exxon Mobil XOM | Company | $318,566,141,324 | $75.24 | — | +$2,879,121,205 | -$4,361,014,700 | — | +0.9% | -1.4% | 4,233,999,872 | $1,070,416,878 | 0.34% | 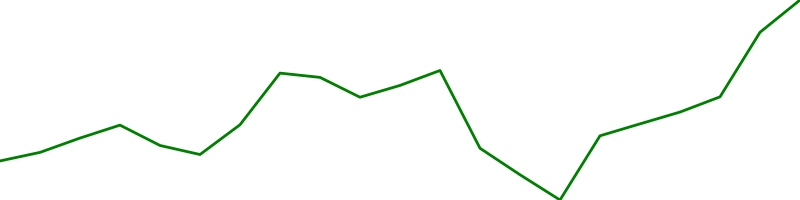 |
United States | Energy | |||
| ☆ | 44 |  |
Wells Fargo WFC | Company | $285,705,558,171 | $58.02 | — | -$1,034,090,058 | +$2,117,433,234 | — | -0.4% | +0.7% | 4,924,259,840 | $720,306,702 | 0.25% |  |
United States | Finance | |||
| ☆ | 45 |  |
Visa V | Company | $284,108,289,976 | $124.24 | — | -$617,437,649 | +$5,396,778,407 | — | -0.2% | +1.9% | 2,286,769,920 | $1,072,936,622 | 0.38% | 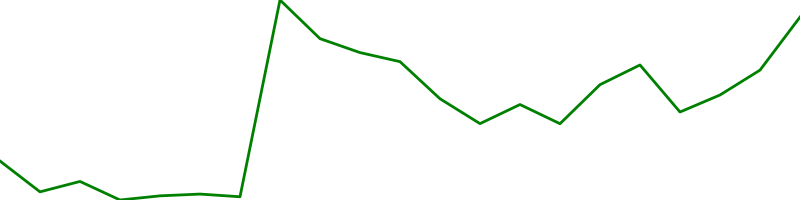 |
United States | Miscellaneous | |||
| ☆ | 46 |  |
SHELL RYDAF | Company | $281,638,922,553 | $31.56 | — | -$1,249,360,428 | +$535,430,457 | — | -0.4% | +0.2% | 8,923,920,384 | $44,184 | 0.00% |  |
United Kingdom | Energy | |||
| ☆ | 49 |  |
Nestle S.A NSRGF | Company | $250,768,438,246 | $80.48 | — | +$1,464,481,451 | +$1,402,173,713 | — | +0.6% | +0.6% | 3,115,909,888 | $2,502,928 | 0.00% |  |
Switzerland | Consumer Defensive | |||
| ☆ | 52 |  |
Intel INTC | Company | $240,083,188,944 | $51.52 | — | -$3,122,191,296 | +$8,248,201,680 | — | -1.3% | +3.6% | 4,659,999,744 | $1,650,927,503 | 0.69% | 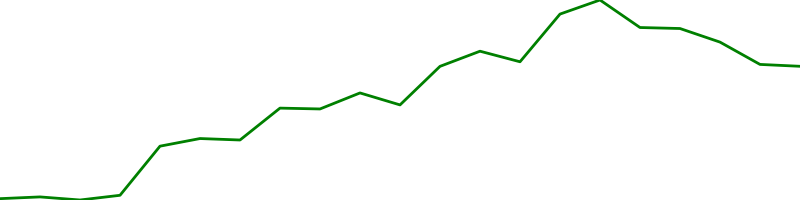 |
United States | Information Technology | |||
| ☆ | 53 |  |
Apple AAPL | Company | $234,656,404,111 | $45.43 | — | +$2,246,882,178 | +$6,327,398,966 | — | +1.0% | +2.8% | 5,165,230,080 | $5,852,674,251 | 2.49% | 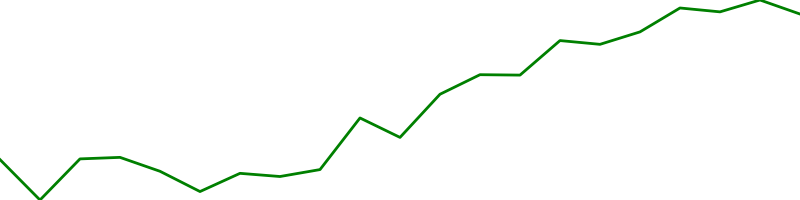 |
United States | Information Technology | |||
| ☆ | 55 |  |
Taiwan Semiconductor Manufacturing TSM | Company | $224,891,739,247 | $45.22 | — | +$3,133,171,873 | +$8,603,772,566 | — | +1.4% | +4.0% | 4,973,280,256 | $234,063,248 | 0.10% | 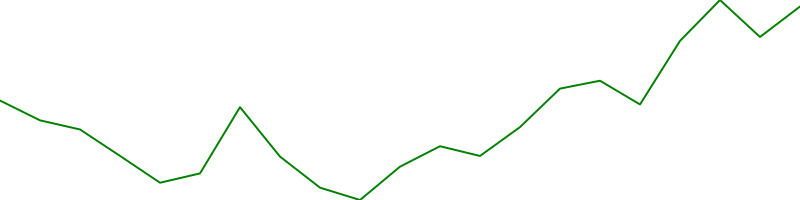 |
Taiwan | Technology | |||
| ☆ | 56 |  |
Chevron CVX | Company | $223,181,020,150 | $116.79 | — | -$821,713,383 | +$6,955,893,234 | — | -0.4% | +3.2% | 1,910,960,000 | $803,164,836 | 0.36% | 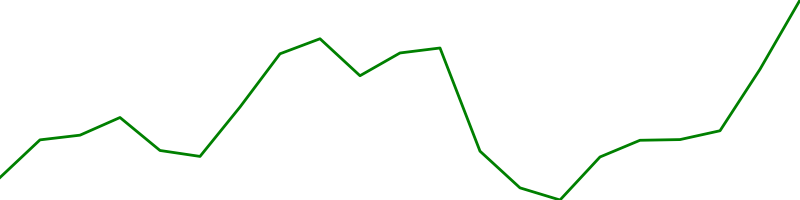 |
United States | Energy | |||
| ☆ | 57 |  |
Anheuser-Busch Inbev BUD | Company | $222,968,122,906 | $115.60 | — | +$790,796,254 | +$7,599,422,656 | — | +0.4% | +3.5% | 1,928,790,016 | $480,976,914 | 0.22% |  |
Belgium | Consumer Non-Durables | |||
| ☆ | 59 |  |
UnitedHealth UNH | Company | $214,312,314,726 | $222.77 | — | -$2,558,999,241 | -$5,397,011,237 | — | -1.2% | -2.5% | 962,033,984 | $694,440,934 | 0.32% | 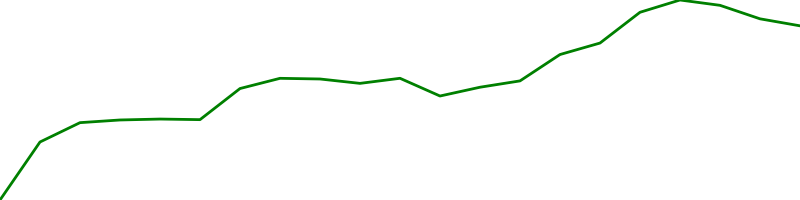 |
United States | Health Care | |||
| ☆ | 61 |  |
Roche RHHBY | Company | $211,702,323,454 | $30.28 | — | +$1,468,219,844 | +$2,586,857,185 | — | +0.7% | +1.2% | 6,991,490,048 | $24,856,853 | 0.01% |  |
Switzerland | Healthcare | |||
| ☆ | 62 |  |
Home Depot HD | Company | $209,856,363,215 | $179.71 | — | -$2,860,983,976 | -$2,370,531,107 | — | -1.3% | -1.1% | 1,167,750,016 | $897,345,977 | 0.43% | 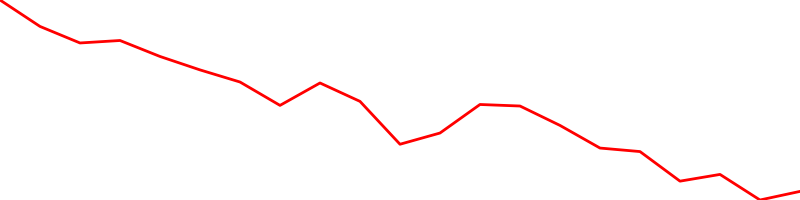 |
United States | Consumer Services | |||
| ☆ | 63 |  |
Cisco CSCO | Company | $208,224,080,199 | $45.55 | — | +$822,840,804 | +$4,708,464,369 | — | +0.4% | +2.3% | 4,571,330,048 | $833,555,876 | 0.40% | 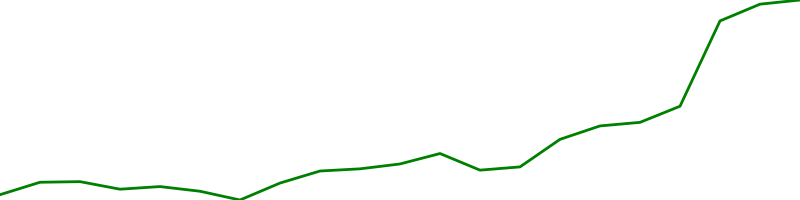 |
United States | Information Technology | |||
| ☆ | 65 |  |
Verizon VZ | Company | $201,444,447,974 | $48.80 | — | -$866,867,834 | +$371,517,036 | — | -0.4% | +0.2% | 4,127,960,064 | $611,283,430 | 0.30% |  |
United States | Communication Services | |||
| ☆ | 66 |  |
Pfizer PFE | Company | $200,780,827,914 | $34.73 | — | -$877,487,235 | +$2,687,301,900 | — | -0.4% | +1.4% | 5,780,469,760 | $922,949,053 | 0.46% |  |
United States | Health Care | |||
| ☆ | 67 |  |
Oracle ORCL | Company | $200,383,093,166 | $52.90 | — | -$265,156,048 | +$6,098,618,015 | — | -0.1% | +3.1% | 3,787,960,064 | $746,334,382 | 0.37% |  |
United States | Technology | |||
| ☆ | 68 |  |
Procter & Gamble PG | Company | $199,498,264,969 | $79.86 | — | -$1,074,183,749 | -$1,074,183,749 | — | -0.5% | -0.5% | 2,498,099,968 | $573,554,524 | 0.29% |  |
United States | Consumer Non-Durables | |||
| ☆ | 69 |  |
HSBC HSBC | Company | $195,857,024,058 | $49.39 | — | -$634,482,574 | +$317,233,724 | — | -0.3% | +0.2% | 3,965,519,872 | $69,550,997 | 0.04% | 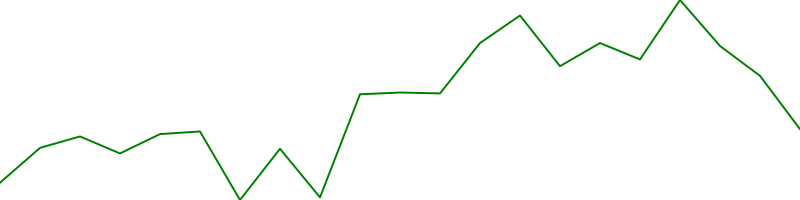 |
United Kingdom | Finance | |||
| ☆ | 70 |  |
Boeing BA | Company | $195,460,336,783 | $344.19 | — | -$5,866,244,342 | -$4,861,094,145 | — | -2.9% | -2.4% | 567,884,992 | $2,095,704,087 | 1.07% |  |
United States | Capital Goods | |||
| ☆ | 71 |  |
Citigroup C | Company | $195,376,713,989 | $76.02 | — | -$231,316,498 | +$4,112,108,104 | — | -0.1% | +2.1% | 2,570,070,016 | $1,018,531,119 | 0.52% |  |
United States | Finance | |||
| ☆ | 73 |  |
Mastercard MA | Company | $189,558,653,107 | $182.54 | — | -$726,927,665 | +$4,164,178,731 | — | -0.4% | +2.2% | 1,038,449,984 | $655,136,036 | 0.35% | 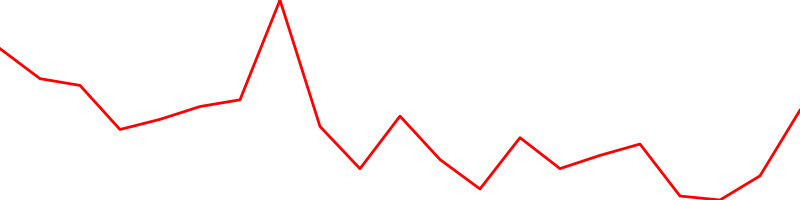 |
United States | Miscellaneous | |||
| ☆ | 74 |  |
China Mobile 0941.HK | Company | $189,554,095,349 | $9.26 | — | +$914,473,984 | +$5,744,966,292 | — | +0.5% | +3.1% | 20,475,500,000 | $134,466,595 | 0.07% | 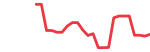 |
Hong Kong | Communication Services | |||
| ☆ | 75 |  |
Coca-Cola KO | Company | $189,542,382,967 | $44.53 | — | -$1,234,391,783 | +$2,724,163,771 | — | -0.6% | +1.5% | 4,256,509,952 | $528,023,367 | 0.28% | 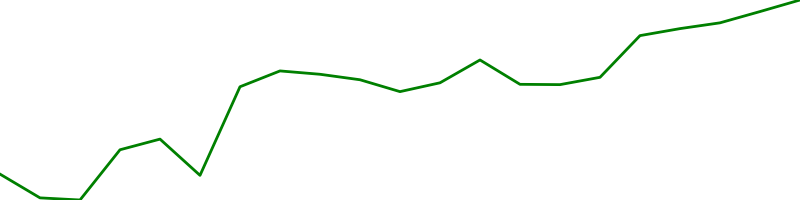 |
United States | Consumer Non-Durables | |||
| ☆ | 77 |  |
Agricultural Bank of China 601288.SS | Company | $183,669,557,892 | $0.64 | — | +$455,766,134 | -$1,186,248,108 | — | +0.2% | -0.6% | 288,425,000,000 | $408,715,986 | 0.22% | 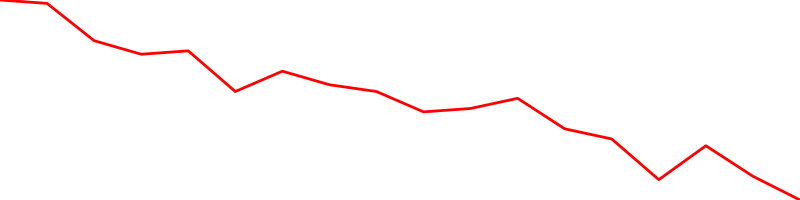 |
China | Financial Services | |||
| ☆ | 78 |  |
AbbVie ABBV | Company | $179,113,306,406 | $118.30 | — | -$1,498,916,197 | +$3,997,117,560 | — | -0.8% | +2.3% | 1,514,060,032 | $578,830,085 | 0.32% | 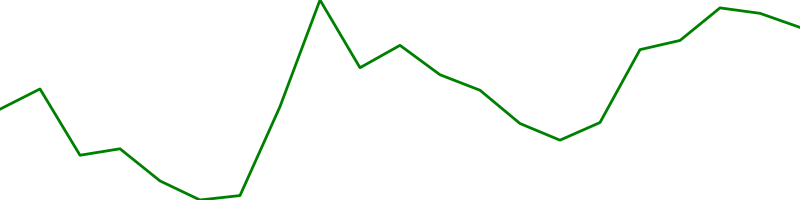 |
United States | Health Care | |||
| ☆ | 79 |  |
Novartis NVSEF | Company | $178,864,488,415 | $78.48 | — | +$3,434,720,191 | +$1,144,912,526 | — | +2.0% | +0.6% | 2,279,010,048 | $314,640 | 0.00% | 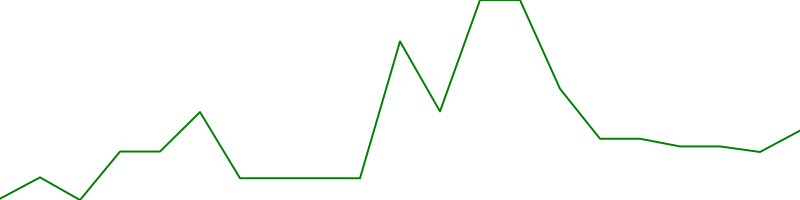 |
Switzerland | Healthcare | |||
| ☆ | 80 |  |
AT&T T | Company | $173,283,817,691 | $28.22 | — | +$1,437,856,218 | +$3,061,235,091 | — | +0.8% | +1.8% | 6,141,000,192 | $833,314,827 | 0.48% |  |
United States | Consumer Services | |||
| ☆ | 81 |  |
Unilever UNLYF | Company | $172,051,213,760 | $60.19 | — | +$4,667,427,521 | +$1,190,992,731 | — | +2.8% | +0.7% | 2,858,400,000 | $26,725 | 0.00% |  |
United Kingdom | Consumer Defensive | |||
| ☆ | 82 |  |
PHILIP MRRS INT-WI PMI.SW | Company | $170,858,884,444 | $108.33 | — | — | +$8,447,293,107 | — | — | +5.2% | 1,577,209,984 | — | — |  |
United States | Consumer Defensive | |||
| ☆ | 84 |  |
Philip Morris PM | Company | $166,409,847,052 | $107.14 | — | -$1,801,717,688 | -$869,788,208 | — | -1.1% | -0.5% | 1,553,200,000 | $544,410,479 | 0.33% | 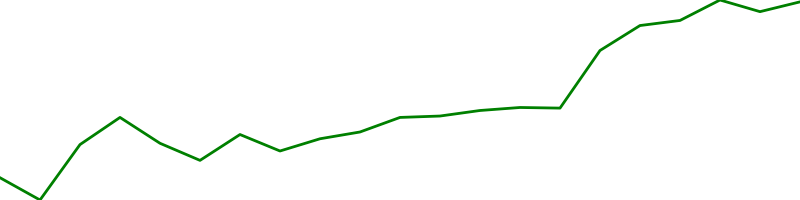 |
United States | Consumer Non-Durables | |||
| ☆ | 85 |  |
DUPONT DE NEMOURS DD.MX | Company | $164,509,319,991 | $189.60 | — | — | +$1,828,168,720 | — | — | +1.1% | 867,662,016 | — | — |  |
United States | Basic Materials | |||
| ☆ | 86 |  |
PepsiCo PEP | Company | $159,862,585,696 | $112.75 | — | +$297,747,199 | +$4,707,261,514 | — | +0.2% | +3.0% | 1,417,849,984 | $508,457,400 | 0.32% |  |
United States | Consumer Staples | |||
| ☆ | 87 |  |
Comcast CMCSA | Company | $158,714,276,455 | $34.64 | — | -$730,014,373 | +$772,959,479 | — | -0.5% | +0.5% | 4,581,929,984 | $663,346,998 | 0.42% |  |
United States | Communication Services | |||
| ☆ | 88 |  |
Walt Disney DIS | Company | $156,413,021,346 | $105.17 | — | +$654,377,856 | +$2,617,534,118 | — | +0.4% | +1.7% | 1,487,239,936 | $682,058,989 | 0.44% | 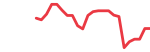 |
United States | Consumer Services | |||
| ☆ | 90 |  |
LVMH-Moet Hennessy Louis Vuitto LVMUY | Company | $153,538,872,830 | $60.82 | — | +$555,388,682 | +$2,549,720,563 | — | +0.4% | +1.7% | 2,524,480,000 | $16,743,746 | 0.01% |  |
France | Consumer Cyclical | |||
| ☆ | 91 |  |
TotalEnergies SE A TOTB.DE | Company | $150,974,710,376 | $56.84 | — | +$1,176,937,798 | +$572,401,161 | — | +0.8% | +0.4% | 2,656,049,920 | $767,706 | 0.00% |  |
France | Energy | |||
| ☆ | 93 |  |
Kweichow Moutai 600519.SS | Company | $141,554,904,603 | $114.40 | — | -$831,008,128 | +$1,234,208,368 | — | -0.6% | +0.9% | 1,237,420,000 | $456,304,252 | 0.32% |  |
China | Consumer Defensive | |||
| ☆ | 94 |  |
International Business Machines IBM | Company | $139,847,224,857 | $153.21 | — | +$828,992,678 | +$2,888,389,266 | — | +0.6% | +2.1% | 912,768,000 | $811,476,496 | 0.58% | 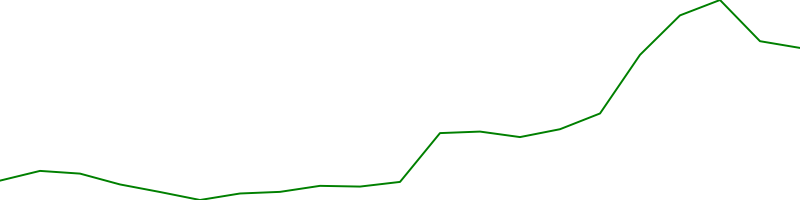 |
United States | Technology | |||
| ☆ | 96 |  |
British American Tobacco p.l.c BTAFF | Company | $136,565,478,896 | $58.40 | — | +$350,771,056 | +$514,461,837 | — | +0.3% | +0.4% | 2,338,449,920 | $70,080 | 0.00% |  |
United Kingdom | Consumer Defensive | |||
| ☆ | 97 |  |
SAP SE SAPGF | Company | $134,337,234,637 | $108.88 | — | +$4,009,882,656 | +$6,020,989,645 | — | +3.1% | +4.7% | 1,233,810,048 | $10,996,880 | 0.01% |  |
Germany | Technology | |||
| ☆ | 98 |  |
BP p.l.c BP | Company | $133,288,683,447 | $39.85 | — | +$635,499,819 | +$2,307,879,851 | — | +0.5% | +1.8% | 3,344,760,064 | $147,684,094 | 0.11% | 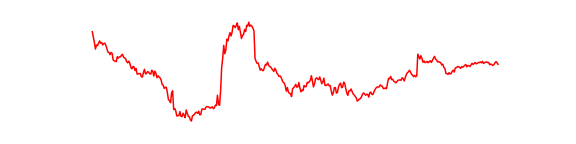 |
United Kingdom | Energy | |||
| ☆ | 100 |  |
Amgen AMGN | Company | $126,503,516,068 | $189.30 | — | -$1,202,888,068 | -$554,665,337 | — | -0.9% | -0.4% | 668,270,016 | $1,319,875,341 | 1.04% |  |
United States | Health Care |